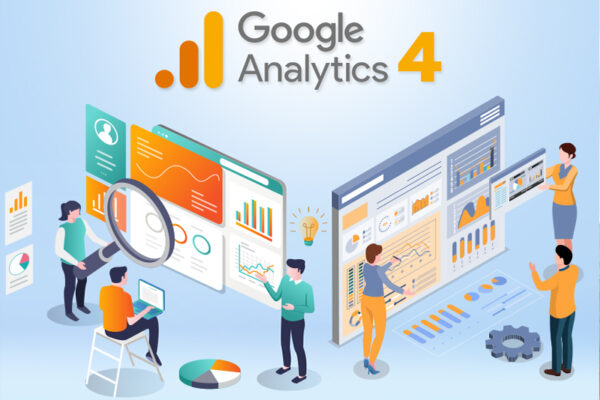
เข้าใจพฤติกรรมลูกค้าอย่างลึกซึ้งด้วย Google Analytics 4

ทำไมการวิเคราะห์เว็บไซต์ด้วย GA4 จึงสำคัญ?

ในยุคดิจิทัลที่ทุกธุรกิจต่างแข่งขันกันเพื่อช่วงชิงใจลูกค้า การเข้าใจพฤติกรรมของลูกค้าจึงเป็นสิ่งสำคัญอย่างยิ่ง Google Analytics 4 (GA4) เครื่องมือวิเคราะห์เว็บไซต์รุ่นใหม่ที่ทรงพลัง ช่วยให้คุณมองเห็นภาพรวมของลูกค้าได้อย่างละเอียดลออ ช่วยให้คุณตัดสินใจทางธุรกิจได้อย่างถูกต้องและมีประสิทธิภาพมากขึ้น

Google Analytics 4 คืออะไร?

GA4 เป็นเครื่องมือวิเคราะห์เว็บไซต์และแอปพลิเคชันรุ่นใหม่ที่พัฒนาโดย Google มาแทนที่ Universal Analytics โดยมีจุดเด่นคือ

  • มุมมองแบบ 360 องศา: GA4 ให้ข้อมูลที่ครอบคลุมทั้งเว็บไซต์และแอปพลิเคชัน ทำให้คุณเห็นภาพรวมของการเดินทางของลูกค้าได้อย่างชัดเจน
  • เน้นการวัดผลลัพธ์: GA4 ช่วยให้คุณวัดผลลัพธ์ได้อย่างแม่นยำมากขึ้น ไม่ว่าจะเป็นการวัดการมีส่วนร่วมของผู้ใช้ การแปลง และรายได้
  • รองรับ Machine Learning: GA4 ใช้เทคโนโลยี Machine Learning เพื่อทำนายพฤติกรรมของลูกค้าในอนาคต ช่วยให้คุณวางแผนกลยุทธ์ได้อย่างมีประสิทธิภาพมากยิ่งขึ้น

ทำไมต้อง GA4?

  • เข้าใจ Customer Journey: ติดตามการเดินทางของลูกค้าตั้งแต่เริ่มต้นจนจบธุรกรรม รู้ว่าลูกค้าสนใจอะไร คลิกที่อะไร และทำอะไรบ้างบนเว็บไซต์ของคุณ
  • ปรับปรุงประสบการณ์ผู้ใช้: แก้ไขปัญหาที่ทำให้ลูกค้าออกจากเว็บไซต์ไป ปรับปรุงการออกแบบเว็บไซต์ให้ใช้งานง่ายขึ้น
  • เพิ่มยอดขาย: วิเคราะห์พฤติกรรมการซื้อของลูกค้า เพื่อนำไปปรับปรุงกลยุทธ์การตลาดและเพิ่มยอดขาย
  • วัดผลแคมเปญ: วัดผลลัพธ์ของแคมเปญการตลาดต่างๆ เพื่อดูว่าแคมเปญใดได้ผลดีที่สุด
  • ทำนายพฤติกรรมในอนาคต: ใช้ข้อมูลที่ได้จาก GA4 เพื่อทำนายพฤติกรรมของลูกค้าในอนาคต ช่วยให้คุณวางแผนกลยุทธ์ได้อย่างมีประสิทธิภาพ

ประโยชน์ที่คุณจะได้รับ

  • เข้าใจลูกค้าของคุณอย่างลึกซึ้ง: รู้ว่าลูกค้าของคุณเป็นใคร มาจากไหน สนใจอะไร และต้องการอะไร
  • ปรับปรุงเว็บไซต์ให้มีประสิทธิภาพมากขึ้น: เพิ่มอัตราการแปลง ลดอัตราการเด้ง และปรับปรุงประสบการณ์ผู้ใช้
  • เพิ่มยอดขายและรายได้: ตัดสินใจทางธุรกิจได้อย่างถูกต้องและมีประสิทธิภาพมากขึ้น
  • แข่งขันได้ในตลาด: เข้าใจพฤติกรรมของคู่แข่งและปรับปรุงกลยุทธ์ของตนเองให้ดีขึ้น

เจาะลึกฟีเจอร์เด่นของ GA4 ที่ช่วยให้เข้าใจลูกค้าได้ดียิ่งขึ้น

1. เหตุการณ์ (Events):

  • ติดตามทุกการกระทำ: GA4 มองทุกการกระทำของผู้ใช้เป็น “เหตุการณ์” ไม่ว่าจะเป็นการคลิกปุ่ม การดูวิดีโอ หรือการซื้อสินค้า ทำให้คุณเห็นภาพรวมของการมีส่วนร่วมของผู้ใช้ได้อย่างละเอียด
  • กำหนดเหตุการณ์เองได้: คุณสามารถกำหนดเหตุการณ์ที่สำคัญต่อธุรกิจของคุณเองได้ เช่น การสมัครรับข่าวสาร การดาวน์โหลดอีบุ๊ก หรือการเพิ่มสินค้าลงในตะกร้า ช่วยให้คุณวิเคราะห์พฤติกรรมเฉพาะเจาะจงได้อย่างแม่นยำ

2. พารามิเตอร์ (Parameters):

  • เพิ่มรายละเอียดให้เหตุการณ์: พารามิเตอร์ช่วยให้คุณเพิ่มข้อมูลเพิ่มเติมเกี่ยวกับเหตุการณ์ เช่น ชื่อสินค้า ราคา หรือหมวดหมู่สินค้า ทำให้คุณสามารถวิเคราะห์ข้อมูลได้ละเอียดขึ้นและสร้างรายงานที่เฉพาะเจาะจงมากขึ้น

3. การวิเคราะห์กลุ่มผู้ใช้ (Audience):

  • แบ่งกลุ่มผู้ใช้ตามพฤติกรรม: GA4 ช่วยให้คุณแบ่งกลุ่มผู้ใช้ตามพฤติกรรมต่างๆ เช่น ผู้ใช้ใหม่ ผู้ใช้ที่กลับมาซื้อซ้ำ ผู้ใช้ที่ทำการซื้อ หรือผู้ใช้ที่ละทิ้งตะกร้าสินค้า
  • สร้างกลุ่มผู้ใช้ที่กำหนดเอง: คุณสามารถสร้างกลุ่มผู้ใช้ที่กำหนดเองตามเกณฑ์ที่คุณต้องการ เช่น ผู้ใช้ที่เข้าชมหน้าผลิตภัณฑ์ A หรือผู้ใช้ที่ใช้เวลาบนเว็บไซต์มากกว่า 30 นาที

4. การทำนาย (Predictions):

  • คาดการณ์พฤติกรรมในอนาคต: GA4 ใช้ Machine Learning เพื่อทำนายพฤติกรรมของผู้ใช้ในอนาคต เช่น ผู้ใช้รายใดมีแนวโน้มที่จะทำการซื้อหรือผู้ใช้รายใดมีแนวโน้มที่จะเลิกใช้บริการ
  • ปรับกลยุทธ์ได้ทันท่วงที: ด้วยข้อมูลการทำนาย คุณสามารถปรับกลยุทธ์การตลาดของคุณได้ทันท่วงที เพื่อเพิ่มโอกาสในการปิดการขายและรักษาลูกค้า

5. การผสานรวมกับเครื่องมืออื่นๆ:

  • เชื่อมต่อกับแพลตฟอร์มอื่นๆ: GA4 สามารถผสานรวมกับเครื่องมืออื่นๆ เช่น Google Ads, BigQuery, และ Looker เพื่อให้คุณสามารถวิเคราะห์ข้อมูลได้อย่างครอบคลุมมากยิ่งขึ้น
  • สร้างภาพรวมที่สมบูรณ์: การผสานรวมข้อมูลจากแหล่งต่างๆ ช่วยให้คุณเห็นภาพรวมของธุรกิจของคุณได้อย่างชัดเจน

ตัวอย่างการนำ GA4 ไปใช้จริง

E-commerce

วิเคราะห์พฤติกรรมการซื้อสินค้าของลูกค้า เพื่อปรับปรุงหน้าผลิตภัณฑ์ เพิ่มยอดขาย และลดอัตราการละทิ้งตะกร้าสินค้า

เว็บไซต์ข่าว

วิเคราะห์เนื้อหาที่ได้รับความนิยม เพื่อผลิตเนื้อหาที่ตรงใจกลุ่มเป้าหมายมากขึ้น

แอปพลิเคชัน

ติดตามพฤติกรรมของผู้ใช้ในแอปพลิเคชัน เพื่อปรับปรุงประสบการณ์การใช้งานและเพิ่มจำนวนผู้ใช้งาน

สรุป

Google Analytics 4 เป็นเครื่องมือที่ทรงพลังที่ช่วยให้คุณเข้าใจพฤติกรรมของลูกค้าได้อย่างลึกซึ้ง และนำข้อมูลเหล่านั้นไปใช้ในการปรับปรุงธุรกิจของคุณ หากคุณต้องการที่จะเติบโตและประสบความสำเร็จในโลกดิจิทัล การเรียนรู้ที่จะใช้ GA4 เป็นสิ่งที่คุณไม่ควรพลาด

SEO สำหรับ Content Marketing: สร้างเนื้อหาที่ทั้งโดนใจ Google และลูกค้า

ในยุคดิจิทัลที่ข้อมูลล้นหลาม การสร้างเนื้อหาที่โดดเด่นและดึงดูดผู้คนให้เข้ามาอ่านเป็นสิ่งสำคัญอย่างยิ่ง แต่การสร้างเนื้อหาที่ดีอย่างเดียวอาจไม่เพียงพอ หากเนื้อหาของคุณไม่มีใครค้นเจอ นั่นคือเหตุผลที่ SEO (Search Engine Optimization) และ Content Marketing ต้องทำงานร่วมกัน

SEO สำหรับ Content Marketing คืออะไร?

SEO สำหรับ Content Marketing หมายถึง การสร้างเนื้อหาที่มีคุณภาพและเป็นประโยชน์ต่อผู้อ่าน พร้อมทั้งปรับแต่งเนื้อหาให้เป็นมิตรกับเครื่องมือค้นหา เช่น Google เพื่อให้เนื้อหาของคุณติดอันดับค้นหาสูงๆ เมื่อผู้คนค้นหาคำที่เกี่ยวข้อง

ทำไม SEO สำหรับ Content Marketing ถึงสำคัญ?

  • เพิ่มการมองเห็น: ทำให้เนื้อหาของคุณเข้าถึงผู้คนได้มากขึ้น
  • ดึงดูดลูกค้าเป้าหมาย: ช่วยให้คุณเข้าถึงกลุ่มเป้าหมายที่สนใจในผลิตภัณฑ์หรือบริการของคุณ
  • สร้างความน่าเชื่อถือ: เนื้อหาที่มีคุณภาพและได้รับการจัดอันดับสูงใน Google จะสร้างความน่าเชื่อถือให้กับแบรนด์ของคุณ
  • เพิ่ม Traffic เข้าเว็บไซต์: ช่วยเพิ่มจำนวนผู้เข้าชมเว็บไซต์ของคุณ
  • เพิ่มโอกาสในการแปลง: ผู้ที่เข้ามาอ่านเนื้อหาของคุณมีแนวโน้มที่จะกลายเป็นลูกค้าของคุณ

เคล็ดลับในการทำ SEO สำหรับ Content Marketing

  • วิเคราะห์คีย์เวิร์ด: ค้นหาคีย์เวิร์ดที่เกี่ยวข้องกับเนื้อหาของคุณและมีปริมาณการค้นหาสูง
  • สร้างเนื้อหาคุณภาพสูง: เนื้อหาของคุณต้องเป็นประโยชน์ น่าสนใจ และตอบคำถามที่ผู้คนต้องการรู้
  • ปรับโครงสร้างเนื้อหา: ใช้หัวข้อ (Heading) และย่อหน้าที่สั้นและชัดเจน
  • ใช้คีย์เวิร์ดอย่างเหมาะสม: ใส่คีย์เวิร์ดใน Title Tag, Meta Description, หัวข้อ และเนื้อหา
  • สร้าง Backlink: สร้างลิงก์จากเว็บไซต์อื่นมายังเนื้อหาของคุณ
  • ปรับปรุงประสบการณ์ผู้ใช้: ทำให้การอ่านเนื้อหาของคุณเป็นเรื่องที่ง่ายและเพลิดเพลิน
  • ติดตามและวิเคราะห์ผลลัพธ์: ใช้เครื่องมือวิเคราะห์เพื่อติดตามประสิทธิภาพของเนื้อหาของคุณ

ตัวอย่าง: บล็อกเกี่ยวกับการทำอาหาร

หากคุณมีบล็อกเกี่ยวกับการทำอาหาร คุณอาจจะสร้างเนื้อหาเกี่ยวกับ “เมนูอาหารกลางวันง่ายๆ” โดยใช้คีย์เวิร์ด เช่น “เมนูอาหารกลางวัน”, “อาหารกลางวันทำง่าย”, “เมนูอาหารกลางวันสุขภาพ” และใส่คีย์เวิร์ดเหล่านี้ใน Title Tag, Meta Description และเนื้อหา นอกจากนี้ คุณอาจจะเพิ่มภาพประกอบและวิดีโอประกอบเพื่อให้เนื้อหาน่าสนใจยิ่งขึ้น

สรุป

SEO สำหรับ Content Marketing เป็นการผสมผสานระหว่างการสร้างเนื้อหาที่มีคุณภาพและการปรับแต่งเนื้อหาให้เป็นมิตรกับเครื่องมือค้นหา การทำ SEO สำหรับ Content Marketing จะช่วยให้เนื้อหาของคุณเข้าถึงผู้คนได้มากขึ้น และสร้างผลลัพธ์ที่เป็นรูปธรรมให้กับธุรกิจของคุณ

คำแนะนำเพิ่มเติม:

  • อย่าลืม Mobile-First: ปรับเนื้อหาให้เหมาะสำหรับการอ่านบนมือถือ
  • สร้างความหลากหลาย: สร้างเนื้อหาในรูปแบบต่างๆ เช่น บทความ, วิดีโอ, Infographic
  • สร้าง Community: สร้างปฏิสัมพันธ์กับผู้อ่านผ่านช่องทางต่างๆ เช่น คอมเมนต์, โซเชียลมีเดีย
  • อัปเดตเนื้อหาอย่างสม่ำเสมอ: สร้างเนื้อหาใหม่ๆ อยู่เสมอเพื่อรักษาความสนใจของผู้อ่าน

SEO สำหรับ Content Marketing คือการลงทุนระยะยาวที่คุ้มค่า หากคุณต้องการให้ธุรกิจของคุณเติบโตอย่างยั่งยืนในโลกออนไลน์ การสร้างเนื้อหาที่ทั้งโดนใจ Google และลูกค้า คือสิ่งที่คุณไม่ควรพลาด

#SEO #ContentMarketing #DigitalMarketing

ต้องการให้ I-Comm Avenu ช่วย หรือมีคำถามอื่นๆ สามารถสอบถามได้เลยครับ

SEO สำหรับธุรกิจขนาดเล็ก : ปลดล็อกศักยภาพ สู่ความสำเร็จในโลกออนไลน์

SEO หรือ Search Engine Optimization คือกุญแจสำคัญที่สามารถพลิกโฉมธุรกิจขนาดเล็กของคุณให้เติบโตอย่างก้าวกระโดดในยุคดิจิทัลนี้ ด้วยการทำให้เว็บไซต์ของคุณปรากฏในอันดับต้น ๆ ของผลการค้นหาของ Google ลูกค้าเป้าหมายจะสามารถค้นพบธุรกิจของคุณได้ง่ายขึ้น ส่งผลให้ยอดขายและชื่อเสียงของแบรนด์ของคุณเพิ่มขึ้นอย่างมีนัยสำคัญ

ทำไม SEO ถึงสำคัญสำหรับธุรกิจขนาดเล็ก?

เพิ่มวิสัยทัศน์

ทำให้ธุรกิจของคุณเป็นที่รู้จักมากขึ้นในวงกว้าง

ดึงดูดลูกค้าเป้าหมาย

เข้าถึงลูกค้าที่กำลังมองหาสินค้าหรือบริการของคุณอยู่พอดี

สร้างความน่าเชื่อถือ

เว็บไซต์ที่ติดอันดับสูงใน Google มักจะได้รับความน่าเชื่อถือจากลูกค้า

ลดค่าใช้จ่าย

เมื่อเทียบกับการลงโฆษณาออนไลน์ การทำ SEO เป็นวิธีที่คุ้มค่ากว่า

การแข่งขันที่เท่าเทียม

ธุรกิจขนาดเล็กสามารถแข่งขันกับธุรกิจขนาดใหญ่ได้อย่างสูสี

เคล็ดลับ SEO สำหรับธุรกิจขนาดเล็ก

วิเคราะห์คีย์เวิร์ดอย่างละเอียด :

  • คีย์เวิร์ดหลัก: คำหลักที่สื่อถึงแก่นของธุรกิจของคุณ เช่น “ร้านอาหารไทย”, “ช่างซ่อมรถ”
  • คีย์เวิร์ดหางยาว: คำหลักที่เจาะจงและมีความยาวมากขึ้น เช่น “ร้านอาหารไทยรสชาติต้นตำรับ ย่านสุขุมวิท”, “ช่างซ่อมรถยนต์นอกสถานที่

สร้างเนื้อหาคุณภาพสูง :

  • บล็อก: เขียนบทความที่ให้ข้อมูลที่เป็นประโยชน์และน่าสนใจแก่ลูกค้า
  • คู่มือ: สร้างคู่มือหรือคู่มือการใช้งานที่เกี่ยวข้องกับผลิตภัณฑ์หรือบริการของคุณ
  • วิดีโอ: สร้างวิดีโอสั้นๆ เพื่ออธิบายสินค้าหรือบริการของคุณ

ปรับปรุง On-Page SEO :

  • Title Tag: เขียนให้สั้น กระชับ และมี Keyword ที่สำคัญ
  • Meta Description: เขียนคำอธิบายที่น่าสนใจเพื่อดึงดูดให้ผู้ใช้คลิก
  • Header Tag: ใช้ Header Tag (H1, H2, H3) เพื่อจัดโครงสร้างเนื้อหาให้ชัดเจน
  • Keyword Density: ใช้ Keyword อย่างเหมาะสมในเนื้อหา แต่ไม่ควรใช้ซ้ำมากเกินไป

สร้าง Backlink คุณภาพ :

  • Guest Posting: เขียนบทความให้เว็บไซต์อื่นและใส่ Backlink กลับมายังเว็บไซต์ของคุณ
  • Directory Listing: ลงทะเบียนธุรกิจของคุณใน Directory ต่างๆ
  • Social Media: แชร์เนื้อหาของคุณบนโซเชียลมีเดีย

ปรับปรุงประสบการณ์ผู้ใช้ :

  • ความเร็วในการโหลด: ทำให้เว็บไซต์โหลดเร็วขึ้น
  • การออกแบบ: ออกแบบเว็บไซต์ให้ใช้งานง่ายและสวยงาม
  • Mobile-Friendly: ตรวจสอบให้แน่ใจว่าเว็บไซต์ของคุณสามารถใช้งานได้ดีบนมือถือ

ใช้ Local SEO :

  • Google My Business: สร้างและปรับปรุง Google My Business Profile
  • รีวิว: กระตุ้นให้ลูกค้ามารีวิวธุรกิจของคุณ
  • Citation: เพิ่มชื่อและข้อมูลธุรกิจของคุณใน Directory ต่างๆ

ติดตามและวิเคราะห์ผลลัพธ์ :

  • Google Analytics: ใช้เครื่องมือวิเคราะห์เพื่อติดตามการเข้าชมเว็บไซต์
  • Google Search Console: ตรวจสอบประสิทธิภาพของ SEO และแก้ไขปัญหาต่างๆ

ตัวอย่าง Case Study : ร้านอาหารไทยเล็กๆ ในซอย

ร้านอาหารไทยเล็กๆ แห่งหนึ่งในย่านทองหล่อ ตัดสินใจทำ SEO โดยเน้นไปที่ Keyword เช่น “อาหารไทยรสชาติต้นตำรับ ทองหล่อ”, “ร้านอาหารไทยบรรยากาศดี” และ “เมนูอาหารไทยแนะนำ” พวกเขาสร้างบล็อกที่เล่าเรื่องราวเกี่ยวกับวัตถุดิบและวิธีการทำอาหารไทยแบบดั้งเดิม นอกจากนี้ยังสร้างวิดีโอแนะนำเมนูใหม่ๆ และจัดโปรโมชั่นพิเศษเพื่อดึงดูดลูกค้า ผลลัพธ์ที่ได้คือ จำนวนลูกค้าเพิ่มขึ้นอย่างต่อเนื่อง และร้านอาหารกลายเป็นที่รู้จักในวงกว้างมากขึ้น

สรุป

SEO เป็นเครื่องมือที่ทรงพลังสำหรับธุรกิจขนาดเล็ก ช่วยให้คุณเข้าถึงลูกค้าเป้าหมายได้อย่างมีประสิทธิภาพและสร้างการเติบโตที่ยั่งยืน หากคุณต้องการประสบความสำเร็จในโลกออนไลน์ การลงทุนกับ SEO คือสิ่งที่คุณไม่ควรพลาด

คำแนะนำเพิ่มเติม:

  • อย่าท้อแท้: ผลลัพธ์ของ SEO อาจไม่ปรากฏให้เห็นทันที ต้องใช้เวลาและความพยายาม
  • เรียนรู้ตลอดเวลา: อัลกอริทึมของ Google เปลี่ยนแปลงอยู่ตลอดเวลา จึงต้องหมั่นศึกษาและปรับปรุงกลยุทธ์ของคุณอยู่เสมอ
  • ปรึกษาผู้เชี่ยวชาญ: หากคุณไม่มั่นใจในการทำ SEO ด้วยตัวเอง คุณสามารถปรึกษาผู้เชี่ยวชาญเพื่อขอคำแนะนำ
  • SEO คือการลงทุนระยะยาวที่คุ้มค่า หากคุณต้องการให้ธุรกิจของคุณเติบโตอย่างยั่งยืนในโลกออนไลน์ การทำ SEO คือสิ่งที่คุณไม่ควรพลาด

#SEO #ธุรกิจขนาดเล็ก #การตลาดออนไลน์

ต้องการให้ I-Comm Avenu ช่วยเรื่อง SEO หรือมีคำถามอื่นๆ สามารถคลิกที่ปุ่ม ติดต่อเราด้านล่างได้เลยครับ

SEO ไม่ใช่เรื่องยากอีกต่อไป! สูตรลับพาเว็บไซต์ติดอันดับ 1 ใน Google ภายใน 30 วัน

เหนื่อยไหมกับการที่เว็บไซต์ของคุณจมอยู่ก้น Google?

อยากให้เว็บไซต์ของคุณติดอันดับต้นๆ และดึงดูดลูกค้าใหม่ๆ เข้ามาที่ธุรกิจของคุณใช่ไหม? ถ้าใช่ บทความนี้คือคำตอบของคุณ!

ทำไม SEO ถึงสำคัญ?

ก่อนที่เราจะไปถึงสูตรลับ ผมขออธิบายก่อนว่าทำไม SEO ถึงสำคัญต่อธุรกิจของคุณ SEO หรือ Search Engine Optimization คือกระบวนการที่ทำให้เว็บไซต์ของคุณปรากฏในอันดับต้นๆ ของผลการค้นหาของ Google เมื่อผู้คนค้นหาคำที่เกี่ยวข้องกับสินค้าหรือบริการของคุณ นั่นหมายความว่ายิ่งเว็บไซต์ของคุณติดอันดับสูงเท่าไหร่ ก็ยิ่งมีโอกาสที่ผู้คนจะเข้ามาเยี่ยมชมเว็บไซต์ของคุณมากขึ้นเท่านั้น

สูตรลับพาเว็บไซต์ติดอันดับ 1 ใน 30 วัน

(จริงๆ แล้วไม่ง่ายขนาดนั้น แต่เราจะทำให้มันง่ายที่สุด)

หมายเหตุ : ไม่มีสูตรลับใดที่จะทำให้เว็บไซต์ของคุณติดอันดับ 1 ได้ภายใน 30 วันเสมอไป การทำ SEO ต้องใช้เวลาและความพยายามอย่างต่อเนื่อง แต่ด้วยเคล็ดลับเหล่านี้ จะช่วยให้คุณก้าวไปสู่เป้าหมายได้เร็วขึ้น

1. ทำความเข้าใจ Google Algorithm :

Google มีอัลกอริทึมที่ซับซ้อนในการจัดอันดับเว็บไซต์ การทำความเข้าใจว่า Google ให้ความสำคัญกับอะไรบ้าง เช่น เนื้อหาคุณภาพ Backlink และประสบการณ์ผู้ใช้ จะช่วยให้คุณปรับปรุงเว็บไซต์ได้ตรงจุด

ปัจจุบัน Google ให้ความสำคัญกับอะไรบ้าง เช่น Core Web Vitals, EAT (Expertise, Authoritativeness, Trustworthiness), หรือการค้นหาด้วยเสียง

2. ค้นหา Keyword ที่ใช่ :

Keyword คือคำที่ผู้คนใช้ค้นหาใน Google การเลือก Keyword ที่เกี่ยวข้องกับธุรกิจของคุณและมีปริมาณการค้นหาสูง จะช่วยให้เว็บไซต์ของคุณถูกค้นพบได้ง่ายขึ้น

วิธีการค้นหา Keyword เช่น การใช้ Keyword Planner, Google Trends, หรือเครื่องมืออื่นๆ รวมถึงการเลือก Keyword ที่มีความเหมาะสมกับเนื้อหาและกลุ่มเป้าหมาย

3. สร้างเนื้อหาคุณภาพสูง :

เนื้อหาคือหัวใจสำคัญของ SEO เนื้อหาของคุณต้องเป็นประโยชน์ต่อผู้อ่าน มีความน่าเชื่อถือ และตอบคำถามที่ผู้คนต้องการรู้ เช่น เช่น บทความบล็อก, วิดีโอ, หรือ Infographic

4. ปรับปรุง On-Page SEO :

On-Page SEO คือการปรับปรุงองค์ประกอบต่างๆ บนหน้าเว็บไซต์ของคุณ เช่น Title Tag, Meta Description, Header Tag และการใช้ Keyword ในเนื้อหา

5. สร้าง Backlink คุณภาพ :

Backlink คือลิงก์ที่เชื่อมโยงจากเว็บไซต์อื่นมายังเว็บไซต์ของคุณ การมี Backlink จากเว็บไซต์ที่มีคุณภาพจะช่วยเพิ่มความน่าเชื่อถือให้กับเว็บไซต์ของคุณ

6. ปรับปรุงประสบการณ์ผู้ใช้ :

ผู้ใช้ต้องการเว็บไซต์ที่โหลดเร็วใช้งานง่าย และมีการออกแบบที่สวยงาม การปรับปรุงประสบการณ์ผู้ใช้จะช่วยให้ผู้ใช้เข้ามาเยี่ยมชมเว็บไซต์ของคุณนานขึ้นและกลับมาเยี่ยมชมอีก

7. ติดตามและวิเคราะห์ผลลัพธ์ :

การติดตามผลลัพธ์จะช่วยให้คุณทราบว่ากลยุทธ์ SEO ของคุณได้ผลหรือไม่ และคุณต้องปรับปรุงอะไรบ้าง

สรุป

SEO ไม่ใช่เรื่องยากอย่างที่คิด เพียงแค่คุณมีความรู้และความเข้าใจในหลักการพื้นฐาน และลงมือปฏิบัติอย่างสม่ำเสมอ คุณก็สามารถพัฒนาเว็บไซต์ของคุณให้ติดอันดับต้นๆ ใน Google ได้

  • อย่าลืมว่า SEO เป็นกระบวนการที่ต้องใช้เวลา: อย่าเพิ่งท้อแท้หากยังไม่เห็นผลลัพธ์ในทันที
  • ติดตามข่าวสารเกี่ยวกับ SEO อยู่เสมอ: Google เปลี่ยนแปลงอัลกอริทึมอยู่ตลอดเวลา การอัปเดตความรู้ของคุณจะช่วยให้คุณปรับตัวได้ทัน
  • ปรึกษาผู้เชี่ยวชาญ: หากคุณไม่มั่นใจในความรู้เรื่อง SEO คุณสามารถปรึกษาผู้เชี่ยวชาญเพื่อขอคำแนะนำ

#SEO #Google #เว็บไซต์ #ธุรกิจออนไลน์

ตลาดดิจิทัลมาร์เก็ตติ้งในประเทศไทย 2024

ในปี พ.ศ. 2567 ตลาดดิจิทัลมาร์เก็ตติ้งในประเทศไทยน่าจะเติบโตอย่างต่อเนื่องและมีบทบาทสำคัญมากขึ้นในกลยุทธ์การตลาดของแบรนด์และธุรกิจต่างๆ โดยมีแนวโน้มสำคัญที่คาดว่าจะเกิดขึ้น ดังนี้

1. การเติบโตของสื่อโซเชียลมีเดียและการทำการตลาดบนแพลตฟอร์มเหล่านี้ เช่น Facebook, Instagram, TikTok, YouTube ซึ่งผู้บริโภคใช้เวลาอยู่บนโซเชียลมีเดียมากขึ้น แบรนด์จึงต้องปรับกลยุทธ์เพื่อเข้าถึงกลุ่มเป้าหมายบนช่องทางดิจิทัลให้มากขึ้น

2. การขยายตัวของ Influencer Marketing โดยใช้ผู้มีอิทธิพลบนโซเชียลมีเดียในการสร้างการรับรู้และความไว้วางใจให้กับแบรนด์ในกลุ่มเป้าหมาย

3. การทำคอนเทนต์มาร์เก็ตติ้งที่สร้างสรรค์และสอดคล้องกับความต้องการ เพื่อดึงดูดความสนใจและสร้างความผูกพันกับผู้บริโภคบนโลกออนไลน์

4. การลงทุนในการวิเคราะห์ข้อมูลและ Big Data มากขึ้น เพื่อทำความเข้าใจพฤติกรรมและความชอบของผู้บริโภค และใช้ข้อมูลเหล่านี้ในการวางกลยุทธ์ดิจิทัลต่างๆ

5. การทำ Personalized Marketing ที่ส่งข้อความสื่อสารเฉพาะบุคคลตรงกับความสนใจของแต่ละคนมากขึ้น ด้วยเทคโนโลยี Machine Learning และ AI

6. การเติบโตของ Mobile Marketing เนื่องจากคนไทยใช้งานสมาร์ทโฟนและอินเทอร์เน็ตเพิ่มมากขึ้น การทำการตลาดผ่านแอปพลิเคชันและแพลตฟอร์มบนมือถือจะได้รับความสนใจมากขึ้น

7. การใช้เทคโนโลยี VR/AR หรือเกม ในการสร้างประสบการณ์ที่น่าสนใจและมีปฏิสัมพันธ์กับผู้บริโภคมากขึ้น

ทั้งนี้ ต้องติดตามกันต่อไปว่าเทรนด์ดิจิทัลมาร์เก็ตติ้งในอนาคตจะเป็นอย่างไร แต่แน่นอนว่าจะมีส่วนสำคัญที่ช่วยขับเคลื่อนการเติบโตของธุรกิจและเศรษฐกิจดิจิทัลในไทยต่อไปครับ

การติดตั้ง event tracking ใน GA4

การติดตั้ง event tracking ใน GA4 นั้นจะต้องใช้ Google Tag Manager (GTM) เพื่อสร้าง event และเชื่อมต่อกับ GA4 ได้อย่างถูกต้อง ดังนั้นขั้นตอนการติดตั้ง event tracking ใน GA4 สามารถทำได้ตามขั้นตอนดังนี้:

1. สร้าง event ใน Google Tag Manager

เข้าไปที่ Google Tag Manager แล้วสร้าง event โดยกดที่ปุ่ม “New Tag” แล้วเลือกประเภทของ event ที่ต้องการสร้าง เช่น click, form submission, scroll หรืออื่นๆ ตามความเหมาะสมกับเว็บไซต์หรือแอพพลิเคชันของคุณ

2. เพิ่ม event tracking code ลงในเว็บไซต์หรือแอพพลิเคชัน

หลังจากสร้าง event เสร็จแล้ว ให้กดที่ปุ่ม “Save” เพื่อเซฟและเปิดใช้งาน event ใน Google Tag Manager จากนั้นคัดลอก event tracking code ที่ได้จาก Google Tag Manager แล้วนำมาวางในเว็บไซต์หรือแอพพลิเคชันของคุณ โดยเป็นการเพิ่ม code ในส่วนของ JavaScript ของเว็บไซต์หรือแอพพลิเคชัน

3. เชื่อมต่อ event tracking code กับ GA4

(ต่อจากข้อ 2) เลือก event ที่ต้องการสร้างเพื่อเชื่อมต่อ แล้วกดปุ่ม “Continue” จากนั้นเลือก “Google Analytics : GA4 Event” แล้วกรอก parameter ต่างๆ ของ event ที่ต้องการสร้าง เช่น event name, event category, event label, event value และอื่นๆ จากนั้นเลือก “Trigger” และเลือก trigger ที่ต้องการใช้งาน เช่น click, form submission, scroll หรืออื่นๆ จากนั้นกดปุ่ม “Save” เพื่อเซฟและเปิดใช้งาน event ใน GA4

4. ตรวจสอบการติดตั้ง event tracking

หลังจากทำการติดตั้ง event tracking ใน GA4 เสร็จแล้ว ให้ทำการตรวจสอบว่า event ที่สร้างไว้สามารถเชื่อมต่อกับ GA4 ได้ถูกต้องหรือไม่ โดยเข้าไปที่ Google Analytics 4 แล้วเลือก “Realtime” แล้วเลือก “Events” จากนั้นดูในส่วนของ “Top events” หรือ “All events” ว่า event ที่สร้างไว้มีการ track หรือไม่ ถ้ามีการ track แสดงว่าการติดตั้ง event tracking ใน GA4 สำเร็จ

โดยสรุปแล้วการติดตั้ง event tracking ใน GA4 จะต้องใช้ Google Tag Manager และมีขั้นตอนที่ค่อนข้างซับซ้อน แต่การติดตั้ง event tracking นั้นเป็นสิ่งที่สำคัญเพื่อให้เข้าใจพฤติกรรมผู้ใช้งานและวิเคราะห์ข้อมูลอย่างมีประสิทธิภาพใน Google Analytics 4

Google Analytics 4 มีประโยชน์อย่างไร?

GA4 หรือ Google Analytics 4 เป็นเครื่องมือวัดและวิเคราะห์การใช้งานเว็บไซต์และแอปพลิเคชันที่มีความสามารถและประโยชน์มากมาย ดังนี้

วัดและวิเคราะห์ผู้ใช้งาน

ใช้ติดตามการเข้าชมเว็บไซต์หรือแอปพลิเคชันและการใช้งานของผู้ใช้ รวมถึงการวิเคราะห์ข้อมูลเกี่ยวกับกลุ่มเป้าหมายของผู้ใช้ เพื่อปรับปรุงประสิทธิภาพในการตลาดและเพิ่มยอดขาย

วิเคราะห์พฤติกรรมผู้ใช้งาน

สามารถติดตามพฤติกรรมของผู้ใช้บนเว็บไซต์หรือแอปพลิเคชัน เช่น การคลิกปุ่ม, การซื้อสินค้า, การสมัครสมาชิก ซึ่งช่วยให้เข้าใจพฤติกรรมของผู้ใช้และสามารถปรับปรุงประสิทธิภาพในการตลาดได้

วิเคราะห์ผลการตลาด

ช่วยวิเคราะห์ผลในทางการตลาดของกิจการ รวมถึงการติดตามและวิเคราะห์การโฆษณาและการตลาดออนไลน์ เพื่อปรับปรุงแผนกการตลาดให้เหมาะสมกับกลุ่มเป้าหมาย

วิเคราะห์ข้อมูลการใช้งานและสื่อสังคมออนไลน์

ช่วยวิเคราะห์การใช้งานและการแชร์บนสื่อสังคมออนไลน์ เพื่อปรับปรุงการตลาดและโฆษณาให้เหมาะสมกับกลุ่มเป้าหมาย

ติดตามและวิเคราะห์การใช้งานทางโทรศัพท์มือถือ

ช่วยติดตามการใช้งานและการทำธุรกรรมบนแอปพลิเคชันที่ใช้งานบนโทรศัพท์มือถือ เพื่อปรับปรุงประสิทธิภาพในการตลาดและการขาย

เชื่อมต่อกับ Google Ads

GA4 สามารถเชื่อมต่อกับ Google Ads เพื่อวิเคราะห์ผลการโฆษณาและการตลาดออนไลน์ ซึ่งช่วยให้ผู้ใช้งานสามารถปรับปรุงกิจกรรมตลาดและโฆษณาได้อย่างมีประสิทธิภาพ

สร้างรายงานและการแจ้งเตือน

GA4 ช่วยให้ผู้ใช้งานสามารถสร้างรายงานและการแจ้งเตือนเมื่อมีกิจกรรมที่สำคัญเกิดขึ้นบนเว็บไซต์หรือแอปพลิเคชัน เช่น การเข้าชมหน้าเว็บไซต์หน้าสินค้าที่ถูกลดราคา เพื่อช่วยให้ผู้ใช้งานตอบสนองได้อย่างรวดเร็ว

สรุปได้ว่า

GA4 เป็นเครื่องมือที่สำคัญสำหรับการวิเคราะห์และปรับปรุงประสิทธิภาพในการตลาด ซึ่งช่วยให้กิจการสามารถปรับปรุงแผนกการตลาดได้อย่างมีประสิทธิภาพและเป็นไปในทิศทางที่ถูกต้องต่อกลุ่มเป้าหมายของตนเองได้

เหตุผลที่ควรเลือกใช้ GCP

GCP (Google Cloud Platform) เป็นพื้นที่คลาวด์ที่ให้บริการโซลูชันการคำนวณและการจัดเก็บข้อมูลต่างๆ โดยมีเทคโนโลยีที่ทันสมัยและมีความน่าเชื่อถือ นี่คือเหตุผลที่คนหลายๆ ใช้ GCP เพื่อเพิ่มประสิทธิภาพและความน่าเชื่อถือของธุรกิจของพวกเขา

เหตุผลที่ควรใช้ GCP

เทคโนโลยีที่ทันสมัย

GCP มีเทคโนโลยีและเครื่องมือที่ทันสมัยและมีประสิทธิภาพในการทำงาน ทำให้ผู้ใช้สามารถพัฒนาแอปพลิเคชันและบริการของพวกเขาได้ด้วยความเร็วและความสะดวก

มีความน่าเชื่อถือ

GCP มีความน่าเชื่อถือสูง เนื่องจากมีเทคโนโลยีการรักษาความปลอดภัยที่มีประสิทธิภาพ และมีการสำรองข้อมูลที่มั่นคง

มีความยืดหยุ่น

GCP มีความยืดหยุ่นในการปรับแต่งตามความต้องการของผู้ใช้ โดยสามารถเลือกใช้บริการและแพลตฟอร์มต่างๆ ตามความต้องการของธุรกิจ

การจัดการและควบคุมงานอย่างมีประสิทธิภาพ

GCP มีเครื่องมือสำหรับการจัดการและควบคุมงานที่มีประสิทธิภาพสูง เช่น Google Cloud Console, Cloud Shell, Stackdriver ซึ่งช่วยให้ผู้ใช้สามารถจัดการและควบคุมงานของพวกเขาได้อย่างมีประสิทธิภาพและสะดวกสบาย

รองรับภาษาและเทคโนโลยีที่หลากหลาย

GCP รองรับภาษาและเทคโนโลยีต่างๆ อย่างกว้างขวาง รวมถึงภาษา Python, Java, Ruby, Node.js, Go และอื่นๆ ซึ่งช่วยให้ผู้ใช้สามารถพัฒนาแอปพลิเคชันของพวกเขาได้อย่างหลากหลาย

ให้บริการที่มีประสิทธิภาพสูง

GCP มีเทคโนโลยีการคำนวณและการจัดเก็บข้อมูลที่มีประสิทธิภาพสูง ทำให้ผู้ใช้สามารถใช้งานได้อย่างรวดเร็วและมีประสิทธิภาพ

มีค่าใช้จ่ายที่ต่ำ

GCP มีราคาที่เหมาะสมและคุ้มค่าสำหรับการใช้บริการคลาวด์ โดยให้ผู้ใช้เลือกใช้บริการตามความต้องการและปริมาณการใช้งานของพวกเขา

สนใจเกี่ยวกับบริการ GCP : Google Cloud Platform ดูรายละเอียดเพิ่มเติมได้ที่นี่

พฤติกรรมการบริโภคผ่านช่องทางออนไลน์ของคนไทยในปี 2023

การเติบโตและการเปลี่ยนแปลง
พฤติกรรมการบริโภคผ่านช่องทางออนไลน์

ในปี 2023 การใช้งานอินเตอร์เน็ตของประเทศไทยจะเติบโตอย่างต่อเนื่อง โดยเฉพาะในส่วนของการใช้งานผ่านมือถือ ซึ่งจะเป็นส่วนสำคัญที่สุดของการเชื่อมต่ออินเตอร์เน็ตในประเทศไทยในอนาคต ซึ่งจะส่งผลให้การใช้งานอินเตอร์เน็ตผ่านมือถือในประเทศไทยจะเพิ่มขึ้นอย่างมาก โดยเฉพาะในกลุ่มผู้ใช้งานที่มีอายุต่ำกว่า 35 ปี ซึ่งเป็นกลุ่มผู้ใช้งานที่มีความสนใจในการใช้งานอินเตอร์เน็ตบนมือถือมากที่สุด

การใช้งานอินเตอร์เน็ตบนมือถือในประเทศไทยจะเป็นการเชื่อมต่ออินเตอร์เน็ตแบบไร้สายและมีความเร็วสูง โดยจะมีการพัฒนาเทคโนโลยี 5G ที่จะช่วยเพิ่มความเร็วในการเชื่อมต่ออินเตอร์เน็ตและเปิดโอกาสให้กับผู้ใช้งานในการเชื่อมต่ออินเตอร์เน็ตแบบไร้สายได้อย่างรวดเร็วและสะดวกสบายมากยิ่งขึ้น

การใช้งานอินเตอร์เน็ตในประเทศไทยในปี 2023 ยังมีการเปลี่ยนแปลงในการใช้งานอินเตอร์เน็ตบนคอมพิวเตอร์และโน๊ตบุ๊ค ซึ่งจะเห็นได้ว่าจะลดลงเรื่อยๆ โดยเฉพาะในกลุ่มผู้ใช้งานที่มีอายุมากกว่า 35 ปี ซึ่งเป็นกลุ่มผู้ใช้งานที่มีความสนใจในการใช้งานอินเตอร์เน็ตบนคอมพิวเตอร์และโน๊ตบุ๊คน้อยลง

การใช้งานอินเตอร์เน็ตมีการเปลี่ยนแปลงในการใช้งานบนโทรทัศน์ โดยจะมีการพัฒนาเทคโนโลยี IPTV ซึ่งเป็นการเชื่อมต่ออินเตอร์เน็ตแบบไร้สายกับโทรทัศน์ ซึ่งจะช่วยเพิ่มความสะดวกสบายให้กับผู้ใช้งานในการเข้าถึงเนื้อหาบนโทรทัศน์ได้อย่างสะดวกสบายมากยิ่งขึ้น

การเติบโตของธุรกิจออนไลน์

การเติบโตของธุรกิจออนไลน์ในประเทศไทยยังคงเป็นที่น่าสนใจอย่างมาก โดยเฉพาะการซื้อขายสินค้าออนไลน์ที่มีการเติบโตอย่างรวดเร็วในช่วงสองสามปีที่ผ่านมา ภายในปี 2023 นี้ คาดว่าจะมีการเพิ่มขึ้นอีกเรื่อยๆ โดยเฉพาะกลุ่มผู้ใช้งานอินเทอร์เน็ตที่เพิ่มขึ้นอย่างต่อเนื่อง และการใช้เทคโนโลยีในการช้อปปิ้งที่สะดวกสบายมากขึ้น

การซื้อขายสินค้าออนไลน์ในปี 2023 นี้จะมีการเปลี่ยนแปลงและพัฒนาต่อไปอย่างต่อเนื่อง เพื่อให้ผู้ซื้อสามารถซื้อขายสินค้าได้อย่างสะดวกสบาย และมีความปลอดภัยในการซื้อขาย ซึ่งจะทำให้ธุรกิจออนไลน์ในประเทศไทยเติบโตอย่างต่อเนื่อง

นอกจากนี้ การซื้อขายสินค้าออนไลน์ในปี 2023 นี้ยังคาดว่าจะมีการเปลี่ยนแปลงในการใช้ช่องทางการชำระเงิน โดยมีการใช้เทคโนโลยีการชำระเงินที่มีความปลอดภัยมากขึ้น เช่นการใช้ระบบ Blockchain ในการชำระเงิน ซึ่งจะทำให้ผู้ซื้อและผู้ขายมีความมั่นใจในการซื้อขายสินค้า

ในส่วนของการขนส่งสินค้า การซื้อขายสินค้าออนไลน์ในปี 2023 นี้ยังคาดว่าจะมีการพัฒนาในการขนส่งสินค้าออนไลน์ โดยมีการใช้เทคโนโลยีในการติดตามการจัดส่งสินค้าอย่างละเอียด และมีการใช้ระบบขนส่งที่มีความปลอดภัยมากขึ้น เพื่อให้ผู้ซื้อได้รับสินค้าที่ต้องการอย่างรวดเร็วและปลอดภัย

ดังนั้น การซื้อขายสินค้าออนไลน์ในปี 2023 นี้จะเป็นการเติบโตอย่างมากในประเทศไทย โดยมีการพัฒนาในการใช้เทคโนโลยีที่ทันสมัย และมีการให้บริการที่มีคุณภาพเพื่อให้ผู้ซื้อได้รับประสบการณ์การซื้อขายสินค้าออนไลน์ที่ดีที่สุด

Specifications and characteristics of data aggregation methods obtained with GA4

Since the announcement about Google ending support for Universal Analytics, it is required to shift to Google Analytics 4 and more opportunities to learn from the reports. This article will summarize the data aggregation methods that Google Analytics 4 is said to have changed significantly from Universal Analytics.

Introduction

App + Web Properties, which allows tracking across apps and the web, was released as a beta version and is now official as Google Analytics 4 (GA4).

The main reasons raised for GA4 are as follows:

1. To respond to major changes in consumer behavior.
2. to respond to the world’s growing emphasis on privacy

In recent years, with the rapid increase in the number of smartphone users, the medium used by users has expanded from the Web to mobile applications. With the current UA, access analysis for apps is difficult, and there is a problem of not being able to identify users across devices.
GA4 appeared in response to these changing times, and in order to grasp users who use all kinds of devices such as smartphones and apps and go through multiple platforms, it has become necessary to conduct access analysis across analysis of the complex consumption behavior and trends of users who move around websites and apps in all directions. This is because it has become necessary to analyze the complex consumption behavior and trends of users who move across websites, apps, and other platforms.
Therefore, GA4 offers the following advantages over traditional universal analytics.

  • Users who browse the Web on a PC and then purchase from an mobile application can now be recognized as the same customer, even if they are using different devices.
  • Now that we can measure on an event-by-event basis, more events can be measured automatically.
  • BigQuery can be linked for free
  • Enhanced machine learning analysis and insights to predict future behavior

As you can see from the above benefits, UA and GA4 have fundamentally changed the way data is measured: while UA converted data received in hits to session-based data, GA4 now collects it in events as user basis.

Data Type Universal Analytics (UA) Google Analytics 4(GA4)
Page view Measure as page view Measure as events
Events Measure as events Measure as events
E-commerce Measure as E-commerce Measure as events
Custom Dimension Measure as custom dimension Dimension per hit = Measured as an event

Dimension per user = user property

GA4 enables user-oriented analysis, so that after a user visits a website or application, it is possible to understand the behavior of the user up to the point of conversion through repeat visits.

Acquisition: Are the users leading to conversions and revenue?
Conversion: Are users who made conversion actions leading to revenue?
Revenue: What are the behaviors of revenue-generating users on the website and app?
User retention: What are the behaviors of users who continue to use the website?

Before starting analysis with GA4, it is necessary to organize the purpose of the website, the purpose of using the data, and the target figures as a basic premise.

For example, for an e-commerce site, the objective is to sell products and services, and the target figures should include which products were purchased the most, which users made the most purchases, and the monthly purchase amount, etc. For a BtoB site, the objective is to collect user information that can be used by sales and find potential customers. For a BtoB website, the objective is to collect user information that can be used by sales and to discover potential customers, which may include the number of inquiries received, the number of documents downloaded, and the number of e-mail magazine subscriptions.

It is very important to have a purpose for the website, the purpose of using the data, and the target values, so that the values measured by GA4 can be evaluated and improved.

In order to analyze GA4 data, reporting functions in the following 3 aggregation methods can be utilized.

1. Aggregate by GA4 report
・Standard report: Finding out a hypothesis
・Exploration report: Dig deeper into the issue based on the hypothesis

2.Aggregate in GA4x Looker studio
・Direct linkage with GA4: Check KPI and monitoring dimensions and metrics

3. Aggregation with GA4xBigQuery
・Link to BigQuery: Dig deeper into issues on a per-user basis

Here are the specifications and characteristics of each.

1. Aggregate by GA4 report

There are two types of report screens in GA4.
There are “Standard Reports” in a standardized format and “Exploration Reports” that users can create by recombining dimensions and indicators as they wish. The “Custom Report” in the traditional Universal Analytics (hereinafter referred to as UA) functionality becomes the “Exploration Report” in GA4.

Standard Reports

Standard Reports

Standard Report Aggregation Methods

GA4 standard reports are often used to formulate hypotheses to analyze. For example, we have an SEO strategy, but are repeat users looking at certain pages the most? Do users who lead to conversions tend to occur at certain events? We make hypotheses by looking at indicator figures such as the following.

The aggregation method of the standard report has an underlying database table, which displays aggregated data measured by GA4.

About some specifications:

If the result of multiplying the radix of each dimension in the report exceeds the maximum number of rows, “(other)” rows will appear in the Analytics.

※Reference:
https://support.google.com/analytics/answer/13208658?visit_id=638127301129422574-1591277467&rd=1&hl=en

In addition, dimensions with more than 500 unique values per day are considered high base numbers and are more likely to reach the report line limit (50,000 lines) and display “(other)” lines.

This does not only affect reports containing custom dimensions with more than 500 types of data, but all standard reports are affected.

Note that if the maximum number of rows is exceeded, (Other) rows will appear in all standard reports, increasing the likelihood of inaccurate measurements.

Additional reference 1:About radix

The radix is the number of unique values assigned to a dimension.
It is a combination of all dimensions in the property.
Some dimensions have a fixed number of unique values. For example, “device” has 3 (PC, tablet, mobile). On the other hand, a dimension with more than 500 unique values in a day is considered a High-Property Dimension.
In a high-likelihood dimension, the number of rows in the report will increase, increasing the likelihood that the upper limit will be reached. Data that exceeds the limit will be aggregated into “(other)” rows.

Aggregation Methods for Exploration Reports

GA4 exploratory reports are used to verify hypotheses made using standard reports. Unlike standard reports, exploratory reports cannot be created unless you have a clear idea of what you want to analyze, since it is necessary to customize the axis of analysis and indicators by yourself.

・Free-form
Graphs and tables can be created by combining indicators such as the number of accesses, users, and events with dimensions such as country, age, and day of the week.

・Funnel exploration
In this report is it possible for to visualize the percentage of the flow. For example, total number of visitors who made final conversion in the flow of TOP page → Column page → Contact form → Inquiry completed. We are able to find out how many users left the site during the steps or how many users lead to final step.

・Path exploration
It is possible to visualize where a user came from to visit the site, and the sequence of movements through the site and the application.

・Segment overlap
User segments can be compared to see the overlap between indicators.

For example, by looking at how many users satisfy the two segments of “visited from Bangkok” and “visited more than twice”, we can find the best customers.

・User explorer
A list of users can be displayed and detailed individual behavioral data can be viewed.

・Cohort exploration
You can visually see the number of repeat visits by users with common attributes. You can see, for example, “how many times the same user accessed the Web site.

・User lifetime
You can check the Lifetime Value (customer lifetime value), which includes the main referral sources that lead to conversions, the behavior of the first visit, and subsequent actions.

The aggregation method of the exploratory report is to set the items to be displayed in the report from the unprocessed data and refer to the report to be displayed by query.

About some specifications:

GA4 is designed for user privacy and thresholds are easily applied.
Selecting a high radix dimension will not produce an “other” line, but sampling and data thresholds are more likely to be applied.

※Reference:About data sampling https://support.google.com/analytics/answer/2637192
※Reference:[GA4] About data thresholds https://support.google.com/analytics/answer/9383630

Additional reference 1:Differences in data between standard and exploration reports


Report type

GA4 Data table

Data that will be shown

Sampling Viewing “(other)”
Standart report Data Tables: Aggregated

Referenced only from aggregated data tables

None

Yes

If the combination of all dimensions in a property exceeds 50,000 rows

Exploration report Data table: Unprocessed (not pre-aggregated)

Include and reference unprocessed data tables

Yes

Free version:10 Million Events

360 (Paid version):Billion Events

None
Additional reference 2:Indication of the presence or absence of data thresholds

In some cases, events measured with thresholds applied may not be displayed in Settings (or Management) > Events. Also, the threshold may be applied even if there is no indication in the indicator that the threshold is applied.

  • How to avoid getting data thresholds
    • Change the reporting identifier to “device-based” and check again
    • Create a report that does not apply thresholds such as “event name by number of events” in the exploration report
    • Increase the time period covered by the report
    • In the “Explore” report, remove dimension related to users
Additional reference 3:Indication of sampling availability

2. Aggregation with GA4xLooker Studio

Looker Studio is a data visualization tool offered free of charge as one tool of the Google Cloud Platform. It allows you to visualize your data using detailed and configurable graphs and tables, easily connects to a variety of data sources, and can be integrated with GA4 to create dashboards of KPIs and metrics to watch and monitor for your marketing targets.

There are two ways to aggregate GA4 data with data visualization tools.
One is to directly “specify GA4 properties” and aggregate the data, and the other is to “link BigQuery”.

1.When aggregating by directly “specifying GA4 properties

<Format of acquisition>
Data is acquired via API when connecting to GA4 from Looker Studio.

<Data to be acquired>
The same data as in the standard report is used for the aggregated data.

*Note
Some dimensions and indicators in the standard report cannot be obtained through the API. In addition, when other rows are displayed in Looker Studio, the values in the other rows are not included in the filter aggregation and correct data cannot be displayed.

Google help:https://developers.google.com/analytics/devguides/reporting/data/v1

Factors such as sampling, data thresholds, and problems with the API itself may make it difficult to determine the cause of whether data is being reflected correctly.

2.When “Linking BigQuery” is used for aggregation

When using “BigQuery integration,” you can handle GA4 raw data for dashboarding, which is more versatile than using aggregated data because raw data can be freely processed.

<Format of acquisition>
Export using the GA4 linkage function.

<Data to be acquired>
RAW data similar to the data used in the search report can be acquired.

*Notes
The data is not exactly the same, as it is only similar to the exploratory report.
Some data will not be output to BigQuery and can only be seen in the exploratory report.
You will need to design and build data tables for BI tools based on your analysis requirements.
*Because referencing with RAW data will increase the amount of data and slow down the operation.

3. Aggregation with GA4xBigQuery

BigQuery is a product offered as part of Google Cloud, Google’s cloud service, and is a data warehouse, BigQuery can process data as large as several TB (1 terabyte = 1,000 GB) or several PB (1 petabyte = 1,024 TB) in seconds or tens of seconds, enabling efficient analysis of a wide variety of data.

The following advantages can be achieved by linking GA4 and BigQuery.

・Analysis that cannot be achieved with GA4’s exploratory reports is possible.

・The ability to combine offline data, CRM data, and other external data for analysis enables the discovery of customer journeys that were previously unseen.

・GA4 can be used for analysis using machine learning functions on Google Cloud Platform.

・Analysis can be performed in conjunction with external BI tools (Tablueau, Power BI, etc.)

Pros Cons Examples of recommended usage scenarios
GA4 report

Standard report

・No need to create default reports as they are displayed in GA4

・No cost

・It is easily affected by sampling and thresholds.

・Difficult to narrow down data

・Difficult to narrow down data
・Insight detailed analysis is not possible

・When using simple indicators to identify general trends

・To use for hypothesizing for analysis

GA4 report
Exploration report
・Easy to generate reports

・No cost

・Difficult to share reports

・Difficult to share reports

・Difficult to get a complete picture of the data

・For individual deep-dive analysis of data

・Trial before analyzing with Looker Studio or BigQuery

・To test hypotheses made using standard reports

GA4 x Looker studio ・Easy to create without engineers or technical IT staffs ・As with the standard report, if the amount of data is too large, it is aggregated into (other).

・Some dimensions and metrics are not available.

・To allow users who are not authorized to view the GA4 report screen to view mainly simple dimension or metrics

・To check KPI and monitoring indicators

GA4xBigQuery ・Easy to obtain data that is difficult and time-consuming to obtain on GA4’s report screen

・Analysis that is not possible with GA4’s exploration reports is possible.

・The analysis can be combined with offline data, CRM data, and other external data, enabling the discovery of customer journeys that were previously invisible.

・GA4 can be used for analysis using machine learning functions on Google Cloud Platform.

・Analysis can be performed in conjunction with external BI tools (Tablueau, Power BI, etc.)

・Costly to build (requires engineers)

・Costly to refer to reports

・When you want to visualize GA4 data precisely

・When you want to dig deeper into issues on a user-by-user basis

・When you want to analyze data integrated with other external data or offline data

GA4 enables cross-device analysis based on users, and there are high expectations that it will enable access analysis that is more in line with actual conditions than UA. It is necessary to utilize reports according to various purposes and usage scenarios.

We offer GA4 implementation support services. Please feel free to contact us.

Google Analytics will stop collecting new hits. Start moving to Google Analytics 4 now

Digital Marketing Situation in Thailand 2022