เข้าใจพฤติกรรมลูกค้าอย่างลึกซึ้งด้วย Google Analytics 4

ทำไมการวิเคราะห์เว็บไซต์ด้วย GA4 จึงสำคัญ?

ในยุคดิจิทัลที่ทุกธุรกิจต่างแข่งขันกันเพื่อช่วงชิงใจลูกค้า การเข้าใจพฤติกรรมของลูกค้าจึงเป็นสิ่งสำคัญอย่างยิ่ง Google Analytics 4 (GA4) เครื่องมือวิเคราะห์เว็บไซต์รุ่นใหม่ที่ทรงพลัง ช่วยให้คุณมองเห็นภาพรวมของลูกค้าได้อย่างละเอียดลออ ช่วยให้คุณตัดสินใจทางธุรกิจได้อย่างถูกต้องและมีประสิทธิภาพมากขึ้น

Google Analytics 4 คืออะไร?

GA4 เป็นเครื่องมือวิเคราะห์เว็บไซต์และแอปพลิเคชันรุ่นใหม่ที่พัฒนาโดย Google มาแทนที่ Universal Analytics โดยมีจุดเด่นคือ
  • มุมมองแบบ 360 องศา: GA4 ให้ข้อมูลที่ครอบคลุมทั้งเว็บไซต์และแอปพลิเคชัน ทำให้คุณเห็นภาพรวมของการเดินทางของลูกค้าได้อย่างชัดเจน
  • เน้นการวัดผลลัพธ์: GA4 ช่วยให้คุณวัดผลลัพธ์ได้อย่างแม่นยำมากขึ้น ไม่ว่าจะเป็นการวัดการมีส่วนร่วมของผู้ใช้ การแปลง และรายได้
  • รองรับ Machine Learning: GA4 ใช้เทคโนโลยี Machine Learning เพื่อทำนายพฤติกรรมของลูกค้าในอนาคต ช่วยให้คุณวางแผนกลยุทธ์ได้อย่างมีประสิทธิภาพมากยิ่งขึ้น

ทำไมต้อง GA4?

  • เข้าใจ Customer Journey: ติดตามการเดินทางของลูกค้าตั้งแต่เริ่มต้นจนจบธุรกรรม รู้ว่าลูกค้าสนใจอะไร คลิกที่อะไร และทำอะไรบ้างบนเว็บไซต์ของคุณ
  • ปรับปรุงประสบการณ์ผู้ใช้: แก้ไขปัญหาที่ทำให้ลูกค้าออกจากเว็บไซต์ไป ปรับปรุงการออกแบบเว็บไซต์ให้ใช้งานง่ายขึ้น
  • เพิ่มยอดขาย: วิเคราะห์พฤติกรรมการซื้อของลูกค้า เพื่อนำไปปรับปรุงกลยุทธ์การตลาดและเพิ่มยอดขาย
  • วัดผลแคมเปญ: วัดผลลัพธ์ของแคมเปญการตลาดต่างๆ เพื่อดูว่าแคมเปญใดได้ผลดีที่สุด
  • ทำนายพฤติกรรมในอนาคต: ใช้ข้อมูลที่ได้จาก GA4 เพื่อทำนายพฤติกรรมของลูกค้าในอนาคต ช่วยให้คุณวางแผนกลยุทธ์ได้อย่างมีประสิทธิภาพ

ประโยชน์ที่คุณจะได้รับ

  • เข้าใจลูกค้าของคุณอย่างลึกซึ้ง: รู้ว่าลูกค้าของคุณเป็นใคร มาจากไหน สนใจอะไร และต้องการอะไร
  • ปรับปรุงเว็บไซต์ให้มีประสิทธิภาพมากขึ้น: เพิ่มอัตราการแปลง ลดอัตราการเด้ง และปรับปรุงประสบการณ์ผู้ใช้
  • เพิ่มยอดขายและรายได้: ตัดสินใจทางธุรกิจได้อย่างถูกต้องและมีประสิทธิภาพมากขึ้น
  • แข่งขันได้ในตลาด: เข้าใจพฤติกรรมของคู่แข่งและปรับปรุงกลยุทธ์ของตนเองให้ดีขึ้น

เจาะลึกฟีเจอร์เด่นของ GA4 ที่ช่วยให้เข้าใจลูกค้าได้ดียิ่งขึ้น

1. เหตุการณ์ (Events):

  • ติดตามทุกการกระทำ: GA4 มองทุกการกระทำของผู้ใช้เป็น “เหตุการณ์” ไม่ว่าจะเป็นการคลิกปุ่ม การดูวิดีโอ หรือการซื้อสินค้า ทำให้คุณเห็นภาพรวมของการมีส่วนร่วมของผู้ใช้ได้อย่างละเอียด
  • กำหนดเหตุการณ์เองได้: คุณสามารถกำหนดเหตุการณ์ที่สำคัญต่อธุรกิจของคุณเองได้ เช่น การสมัครรับข่าวสาร การดาวน์โหลดอีบุ๊ก หรือการเพิ่มสินค้าลงในตะกร้า ช่วยให้คุณวิเคราะห์พฤติกรรมเฉพาะเจาะจงได้อย่างแม่นยำ

2. พารามิเตอร์ (Parameters):

  • เพิ่มรายละเอียดให้เหตุการณ์: พารามิเตอร์ช่วยให้คุณเพิ่มข้อมูลเพิ่มเติมเกี่ยวกับเหตุการณ์ เช่น ชื่อสินค้า ราคา หรือหมวดหมู่สินค้า ทำให้คุณสามารถวิเคราะห์ข้อมูลได้ละเอียดขึ้นและสร้างรายงานที่เฉพาะเจาะจงมากขึ้น

3. การวิเคราะห์กลุ่มผู้ใช้ (Audience):

  • แบ่งกลุ่มผู้ใช้ตามพฤติกรรม: GA4 ช่วยให้คุณแบ่งกลุ่มผู้ใช้ตามพฤติกรรมต่างๆ เช่น ผู้ใช้ใหม่ ผู้ใช้ที่กลับมาซื้อซ้ำ ผู้ใช้ที่ทำการซื้อ หรือผู้ใช้ที่ละทิ้งตะกร้าสินค้า
  • สร้างกลุ่มผู้ใช้ที่กำหนดเอง: คุณสามารถสร้างกลุ่มผู้ใช้ที่กำหนดเองตามเกณฑ์ที่คุณต้องการ เช่น ผู้ใช้ที่เข้าชมหน้าผลิตภัณฑ์ A หรือผู้ใช้ที่ใช้เวลาบนเว็บไซต์มากกว่า 30 นาที

4. การทำนาย (Predictions):

  • คาดการณ์พฤติกรรมในอนาคต: GA4 ใช้ Machine Learning เพื่อทำนายพฤติกรรมของผู้ใช้ในอนาคต เช่น ผู้ใช้รายใดมีแนวโน้มที่จะทำการซื้อหรือผู้ใช้รายใดมีแนวโน้มที่จะเลิกใช้บริการ
  • ปรับกลยุทธ์ได้ทันท่วงที: ด้วยข้อมูลการทำนาย คุณสามารถปรับกลยุทธ์การตลาดของคุณได้ทันท่วงที เพื่อเพิ่มโอกาสในการปิดการขายและรักษาลูกค้า

5. การผสานรวมกับเครื่องมืออื่นๆ:

  • เชื่อมต่อกับแพลตฟอร์มอื่นๆ: GA4 สามารถผสานรวมกับเครื่องมืออื่นๆ เช่น Google Ads, BigQuery, และ Looker เพื่อให้คุณสามารถวิเคราะห์ข้อมูลได้อย่างครอบคลุมมากยิ่งขึ้น
  • สร้างภาพรวมที่สมบูรณ์: การผสานรวมข้อมูลจากแหล่งต่างๆ ช่วยให้คุณเห็นภาพรวมของธุรกิจของคุณได้อย่างชัดเจน

ตัวอย่างการนำ GA4 ไปใช้จริง

E-commerce

วิเคราะห์พฤติกรรมการซื้อสินค้าของลูกค้า เพื่อปรับปรุงหน้าผลิตภัณฑ์ เพิ่มยอดขาย และลดอัตราการละทิ้งตะกร้าสินค้า

เว็บไซต์ข่าว

วิเคราะห์เนื้อหาที่ได้รับความนิยม เพื่อผลิตเนื้อหาที่ตรงใจกลุ่มเป้าหมายมากขึ้น

แอปพลิเคชัน

ติดตามพฤติกรรมของผู้ใช้ในแอปพลิเคชัน เพื่อปรับปรุงประสบการณ์การใช้งานและเพิ่มจำนวนผู้ใช้งาน

สรุป

Google Analytics 4 เป็นเครื่องมือที่ทรงพลังที่ช่วยให้คุณเข้าใจพฤติกรรมของลูกค้าได้อย่างลึกซึ้ง และนำข้อมูลเหล่านั้นไปใช้ในการปรับปรุงธุรกิจของคุณ หากคุณต้องการที่จะเติบโตและประสบความสำเร็จในโลกดิจิทัล การเรียนรู้ที่จะใช้ GA4 เป็นสิ่งที่คุณไม่ควรพลาด

การติดตั้ง event tracking ใน GA4

การติดตั้ง event tracking ใน GA4 นั้นจะต้องใช้ Google Tag Manager (GTM) เพื่อสร้าง event และเชื่อมต่อกับ GA4 ได้อย่างถูกต้อง ดังนั้นขั้นตอนการติดตั้ง event tracking ใน GA4 สามารถทำได้ตามขั้นตอนดังนี้:

1. สร้าง event ใน Google Tag Manager

เข้าไปที่ Google Tag Manager แล้วสร้าง event โดยกดที่ปุ่ม “New Tag” แล้วเลือกประเภทของ event ที่ต้องการสร้าง เช่น click, form submission, scroll หรืออื่นๆ ตามความเหมาะสมกับเว็บไซต์หรือแอพพลิเคชันของคุณ

2. เพิ่ม event tracking code ลงในเว็บไซต์หรือแอพพลิเคชัน

หลังจากสร้าง event เสร็จแล้ว ให้กดที่ปุ่ม “Save” เพื่อเซฟและเปิดใช้งาน event ใน Google Tag Manager จากนั้นคัดลอก event tracking code ที่ได้จาก Google Tag Manager แล้วนำมาวางในเว็บไซต์หรือแอพพลิเคชันของคุณ โดยเป็นการเพิ่ม code ในส่วนของ JavaScript ของเว็บไซต์หรือแอพพลิเคชัน

3. เชื่อมต่อ event tracking code กับ GA4

(ต่อจากข้อ 2) เลือก event ที่ต้องการสร้างเพื่อเชื่อมต่อ แล้วกดปุ่ม “Continue” จากนั้นเลือก “Google Analytics : GA4 Event” แล้วกรอก parameter ต่างๆ ของ event ที่ต้องการสร้าง เช่น event name, event category, event label, event value และอื่นๆ จากนั้นเลือก “Trigger” และเลือก trigger ที่ต้องการใช้งาน เช่น click, form submission, scroll หรืออื่นๆ จากนั้นกดปุ่ม “Save” เพื่อเซฟและเปิดใช้งาน event ใน GA4

4. ตรวจสอบการติดตั้ง event tracking

หลังจากทำการติดตั้ง event tracking ใน GA4 เสร็จแล้ว ให้ทำการตรวจสอบว่า event ที่สร้างไว้สามารถเชื่อมต่อกับ GA4 ได้ถูกต้องหรือไม่ โดยเข้าไปที่ Google Analytics 4 แล้วเลือก “Realtime” แล้วเลือก “Events” จากนั้นดูในส่วนของ “Top events” หรือ “All events” ว่า event ที่สร้างไว้มีการ track หรือไม่ ถ้ามีการ track แสดงว่าการติดตั้ง event tracking ใน GA4 สำเร็จ

โดยสรุปแล้วการติดตั้ง event tracking ใน GA4 จะต้องใช้ Google Tag Manager และมีขั้นตอนที่ค่อนข้างซับซ้อน แต่การติดตั้ง event tracking นั้นเป็นสิ่งที่สำคัญเพื่อให้เข้าใจพฤติกรรมผู้ใช้งานและวิเคราะห์ข้อมูลอย่างมีประสิทธิภาพใน Google Analytics 4

Google Analytics 4 มีประโยชน์อย่างไร?

GA4 หรือ Google Analytics 4 เป็นเครื่องมือวัดและวิเคราะห์การใช้งานเว็บไซต์และแอปพลิเคชันที่มีความสามารถและประโยชน์มากมาย ดังนี้

วัดและวิเคราะห์ผู้ใช้งาน

ใช้ติดตามการเข้าชมเว็บไซต์หรือแอปพลิเคชันและการใช้งานของผู้ใช้ รวมถึงการวิเคราะห์ข้อมูลเกี่ยวกับกลุ่มเป้าหมายของผู้ใช้ เพื่อปรับปรุงประสิทธิภาพในการตลาดและเพิ่มยอดขาย

วิเคราะห์พฤติกรรมผู้ใช้งาน

สามารถติดตามพฤติกรรมของผู้ใช้บนเว็บไซต์หรือแอปพลิเคชัน เช่น การคลิกปุ่ม, การซื้อสินค้า, การสมัครสมาชิก ซึ่งช่วยให้เข้าใจพฤติกรรมของผู้ใช้และสามารถปรับปรุงประสิทธิภาพในการตลาดได้

วิเคราะห์ผลการตลาด

ช่วยวิเคราะห์ผลในทางการตลาดของกิจการ รวมถึงการติดตามและวิเคราะห์การโฆษณาและการตลาดออนไลน์ เพื่อปรับปรุงแผนกการตลาดให้เหมาะสมกับกลุ่มเป้าหมาย

วิเคราะห์ข้อมูลการใช้งานและสื่อสังคมออนไลน์

ช่วยวิเคราะห์การใช้งานและการแชร์บนสื่อสังคมออนไลน์ เพื่อปรับปรุงการตลาดและโฆษณาให้เหมาะสมกับกลุ่มเป้าหมาย

ติดตามและวิเคราะห์การใช้งานทางโทรศัพท์มือถือ

ช่วยติดตามการใช้งานและการทำธุรกรรมบนแอปพลิเคชันที่ใช้งานบนโทรศัพท์มือถือ เพื่อปรับปรุงประสิทธิภาพในการตลาดและการขาย

เชื่อมต่อกับ Google Ads

GA4 สามารถเชื่อมต่อกับ Google Ads เพื่อวิเคราะห์ผลการโฆษณาและการตลาดออนไลน์ ซึ่งช่วยให้ผู้ใช้งานสามารถปรับปรุงกิจกรรมตลาดและโฆษณาได้อย่างมีประสิทธิภาพ

สร้างรายงานและการแจ้งเตือน

GA4 ช่วยให้ผู้ใช้งานสามารถสร้างรายงานและการแจ้งเตือนเมื่อมีกิจกรรมที่สำคัญเกิดขึ้นบนเว็บไซต์หรือแอปพลิเคชัน เช่น การเข้าชมหน้าเว็บไซต์หน้าสินค้าที่ถูกลดราคา เพื่อช่วยให้ผู้ใช้งานตอบสนองได้อย่างรวดเร็ว

สรุปได้ว่า

GA4 เป็นเครื่องมือที่สำคัญสำหรับการวิเคราะห์และปรับปรุงประสิทธิภาพในการตลาด ซึ่งช่วยให้กิจการสามารถปรับปรุงแผนกการตลาดได้อย่างมีประสิทธิภาพและเป็นไปในทิศทางที่ถูกต้องต่อกลุ่มเป้าหมายของตนเองได้

Why GA4 setup is more difficult than UA?

Specifications and characteristics of data aggregation methods obtained with GA4

Since the announcement about Google ending support for Universal Analytics, it is required to shift to Google Analytics 4 and more opportunities to learn from the reports. This article will summarize the data aggregation methods that Google Analytics 4 is said to have changed significantly from Universal Analytics.

Introduction

App + Web Properties, which allows tracking across apps and the web, was released as a beta version and is now official as Google Analytics 4 (GA4).

The main reasons raised for GA4 are as follows:

1. To respond to major changes in consumer behavior.
2. to respond to the world’s growing emphasis on privacy

In recent years, with the rapid increase in the number of smartphone users, the medium used by users has expanded from the Web to mobile applications. With the current UA, access analysis for apps is difficult, and there is a problem of not being able to identify users across devices.
GA4 appeared in response to these changing times, and in order to grasp users who use all kinds of devices such as smartphones and apps and go through multiple platforms, it has become necessary to conduct access analysis across analysis of the complex consumption behavior and trends of users who move around websites and apps in all directions. This is because it has become necessary to analyze the complex consumption behavior and trends of users who move across websites, apps, and other platforms.
Therefore, GA4 offers the following advantages over traditional universal analytics.

  • Users who browse the Web on a PC and then purchase from an mobile application can now be recognized as the same customer, even if they are using different devices.
  • Now that we can measure on an event-by-event basis, more events can be measured automatically.
  • BigQuery can be linked for free
  • Enhanced machine learning analysis and insights to predict future behavior

As you can see from the above benefits, UA and GA4 have fundamentally changed the way data is measured: while UA converted data received in hits to session-based data, GA4 now collects it in events as user basis.

Data Type Universal Analytics (UA) Google Analytics 4(GA4)
Page view Measure as page view Measure as events
Events Measure as events Measure as events
E-commerce Measure as E-commerce Measure as events
Custom Dimension Measure as custom dimension Dimension per hit = Measured as an event

Dimension per user = user property

GA4 enables user-oriented analysis, so that after a user visits a website or application, it is possible to understand the behavior of the user up to the point of conversion through repeat visits.

Acquisition: Are the users leading to conversions and revenue?
Conversion: Are users who made conversion actions leading to revenue?
Revenue: What are the behaviors of revenue-generating users on the website and app?
User retention: What are the behaviors of users who continue to use the website?

Before starting analysis with GA4, it is necessary to organize the purpose of the website, the purpose of using the data, and the target figures as a basic premise.

For example, for an e-commerce site, the objective is to sell products and services, and the target figures should include which products were purchased the most, which users made the most purchases, and the monthly purchase amount, etc. For a BtoB site, the objective is to collect user information that can be used by sales and find potential customers. For a BtoB website, the objective is to collect user information that can be used by sales and to discover potential customers, which may include the number of inquiries received, the number of documents downloaded, and the number of e-mail magazine subscriptions.

It is very important to have a purpose for the website, the purpose of using the data, and the target values, so that the values measured by GA4 can be evaluated and improved.

In order to analyze GA4 data, reporting functions in the following 3 aggregation methods can be utilized.

1. Aggregate by GA4 report
・Standard report: Finding out a hypothesis
・Exploration report: Dig deeper into the issue based on the hypothesis

2.Aggregate in GA4x Looker studio
・Direct linkage with GA4: Check KPI and monitoring dimensions and metrics

3. Aggregation with GA4xBigQuery
・Link to BigQuery: Dig deeper into issues on a per-user basis

Here are the specifications and characteristics of each.

1. Aggregate by GA4 report

There are two types of report screens in GA4.
There are “Standard Reports” in a standardized format and “Exploration Reports” that users can create by recombining dimensions and indicators as they wish. The “Custom Report” in the traditional Universal Analytics (hereinafter referred to as UA) functionality becomes the “Exploration Report” in GA4.

Standard Reports

Standard Reports

Standard Report Aggregation Methods

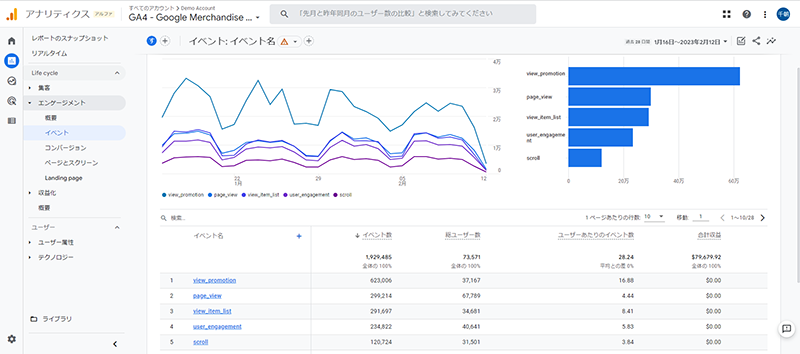
GA4 standard reports are often used to formulate hypotheses to analyze. For example, we have an SEO strategy, but are repeat users looking at certain pages the most? Do users who lead to conversions tend to occur at certain events? We make hypotheses by looking at indicator figures such as the following.

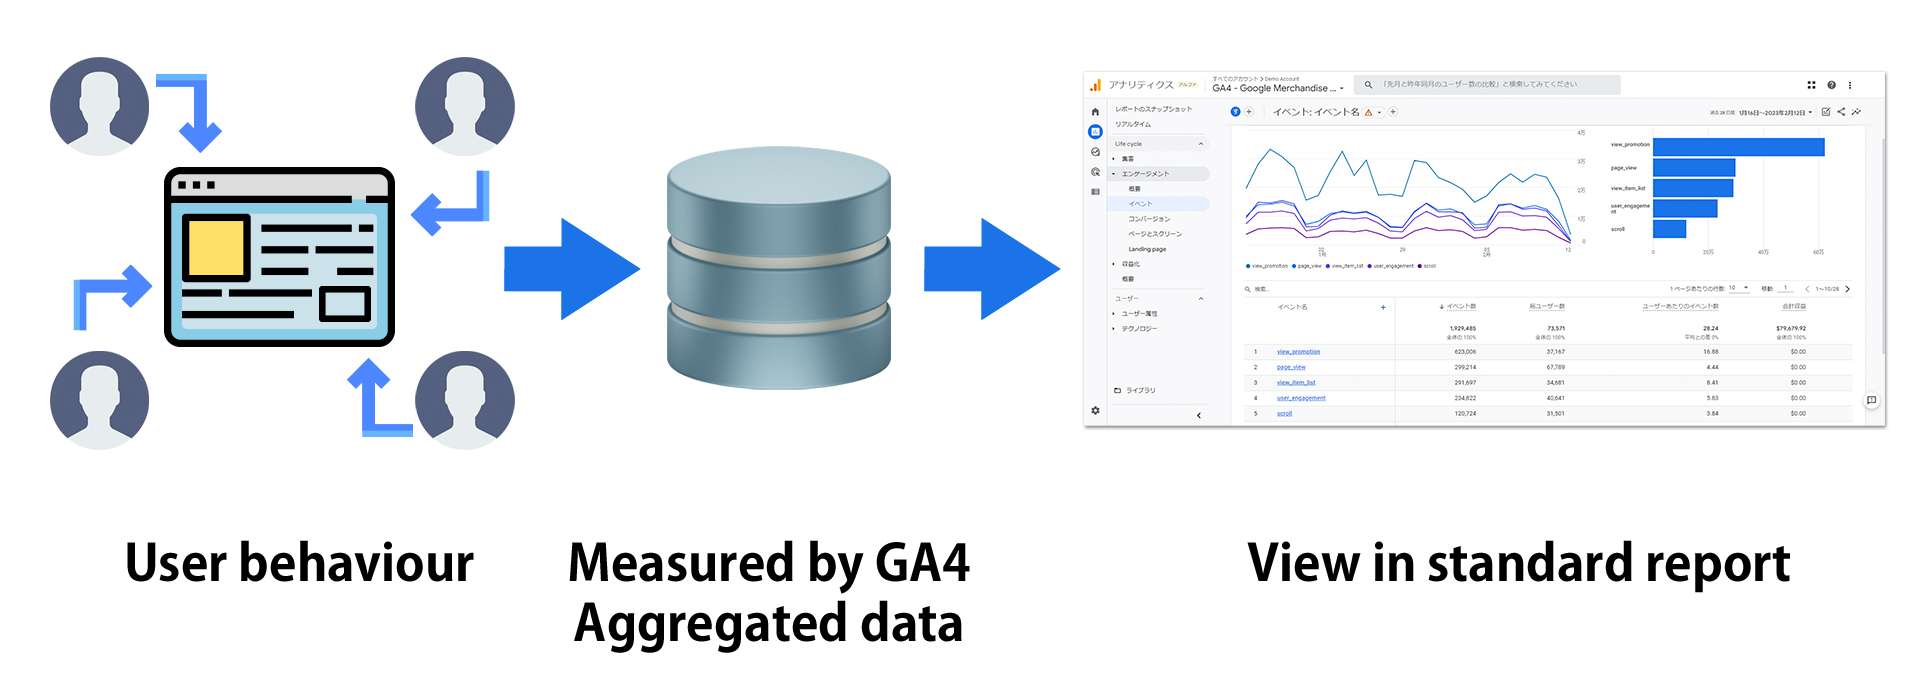
The aggregation method of the standard report has an underlying database table, which displays aggregated data measured by GA4.

About some specifications:

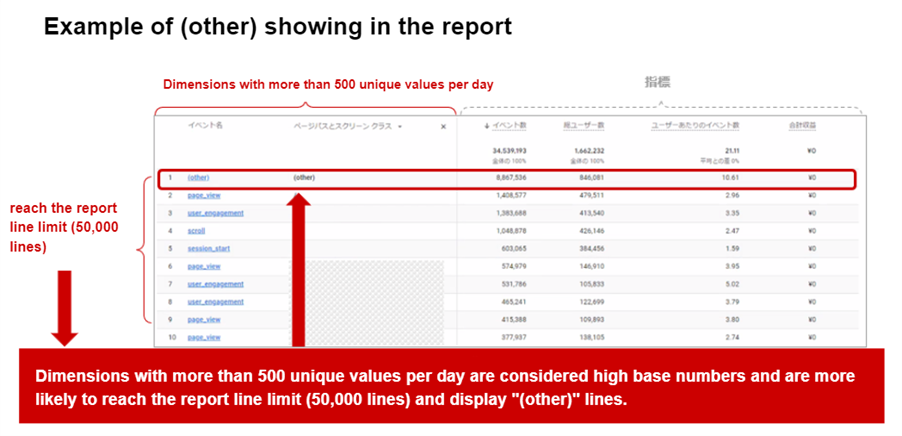
If the result of multiplying the radix of each dimension in the report exceeds the maximum number of rows, “(other)” rows will appear in the Analytics.

※Reference:
https://support.google.com/analytics/answer/13208658?visit_id=638127301129422574-1591277467&rd=1&hl=en

In addition, dimensions with more than 500 unique values per day are considered high base numbers and are more likely to reach the report line limit (50,000 lines) and display “(other)” lines.

This does not only affect reports containing custom dimensions with more than 500 types of data, but all standard reports are affected.

Note that if the maximum number of rows is exceeded, (Other) rows will appear in all standard reports, increasing the likelihood of inaccurate measurements.

Additional reference 1:About radix

The radix is the number of unique values assigned to a dimension.
It is a combination of all dimensions in the property.
Some dimensions have a fixed number of unique values. For example, “device” has 3 (PC, tablet, mobile). On the other hand, a dimension with more than 500 unique values in a day is considered a High-Property Dimension.
In a high-likelihood dimension, the number of rows in the report will increase, increasing the likelihood that the upper limit will be reached. Data that exceeds the limit will be aggregated into “(other)” rows.

Aggregation Methods for Exploration Reports

GA4 exploratory reports are used to verify hypotheses made using standard reports. Unlike standard reports, exploratory reports cannot be created unless you have a clear idea of what you want to analyze, since it is necessary to customize the axis of analysis and indicators by yourself.

・Free-form
Graphs and tables can be created by combining indicators such as the number of accesses, users, and events with dimensions such as country, age, and day of the week.

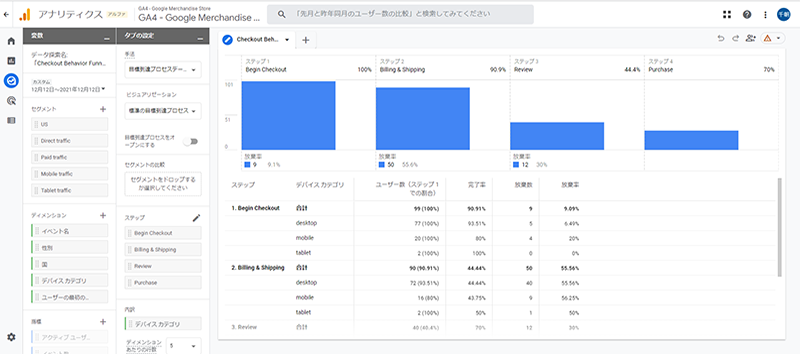
・Funnel exploration
In this report is it possible for to visualize the percentage of the flow. For example, total number of visitors who made final conversion in the flow of TOP page → Column page → Contact form → Inquiry completed. We are able to find out how many users left the site during the steps or how many users lead to final step.

・Path exploration
It is possible to visualize where a user came from to visit the site, and the sequence of movements through the site and the application.

・Segment overlap
User segments can be compared to see the overlap between indicators.

For example, by looking at how many users satisfy the two segments of “visited from Bangkok” and “visited more than twice”, we can find the best customers.

・User explorer
A list of users can be displayed and detailed individual behavioral data can be viewed.

・Cohort exploration
You can visually see the number of repeat visits by users with common attributes. You can see, for example, “how many times the same user accessed the Web site.

・User lifetime
You can check the Lifetime Value (customer lifetime value), which includes the main referral sources that lead to conversions, the behavior of the first visit, and subsequent actions.

The aggregation method of the exploratory report is to set the items to be displayed in the report from the unprocessed data and refer to the report to be displayed by query.

About some specifications:

GA4 is designed for user privacy and thresholds are easily applied.
Selecting a high radix dimension will not produce an “other” line, but sampling and data thresholds are more likely to be applied.

※Reference:About data sampling https://support.google.com/analytics/answer/2637192
※Reference:[GA4] About data thresholds https://support.google.com/analytics/answer/9383630

Additional reference 1:Differences in data between standard and exploration reports


Report type

GA4 Data table

Data that will be shown

Sampling Viewing “(other)”
Standart report Data Tables: Aggregated

Referenced only from aggregated data tables

None

Yes

If the combination of all dimensions in a property exceeds 50,000 rows

Exploration report Data table: Unprocessed (not pre-aggregated)

Include and reference unprocessed data tables

Yes

Free version:10 Million Events

360 (Paid version):Billion Events

None
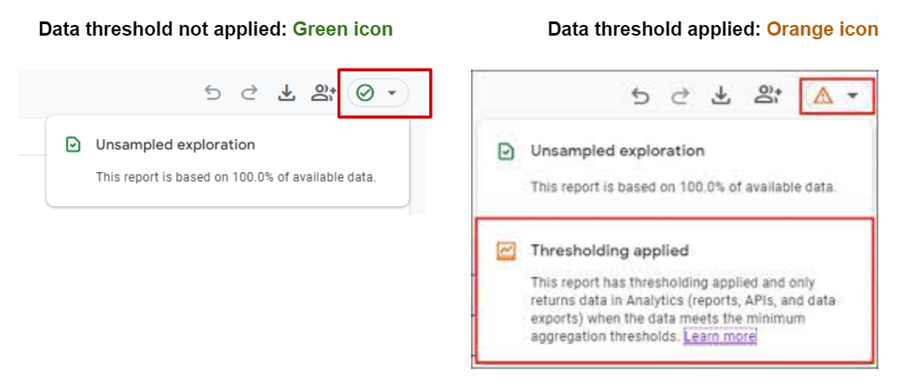
Additional reference 2:Indication of the presence or absence of data thresholds

In some cases, events measured with thresholds applied may not be displayed in Settings (or Management) > Events. Also, the threshold may be applied even if there is no indication in the indicator that the threshold is applied.

  • How to avoid getting data thresholds
    • Change the reporting identifier to “device-based” and check again
    • Create a report that does not apply thresholds such as “event name by number of events” in the exploration report
    • Increase the time period covered by the report
    • In the “Explore” report, remove dimension related to users
Additional reference 3:Indication of sampling availability

2. Aggregation with GA4xLooker Studio

Looker Studio is a data visualization tool offered free of charge as one tool of the Google Cloud Platform. It allows you to visualize your data using detailed and configurable graphs and tables, easily connects to a variety of data sources, and can be integrated with GA4 to create dashboards of KPIs and metrics to watch and monitor for your marketing targets.

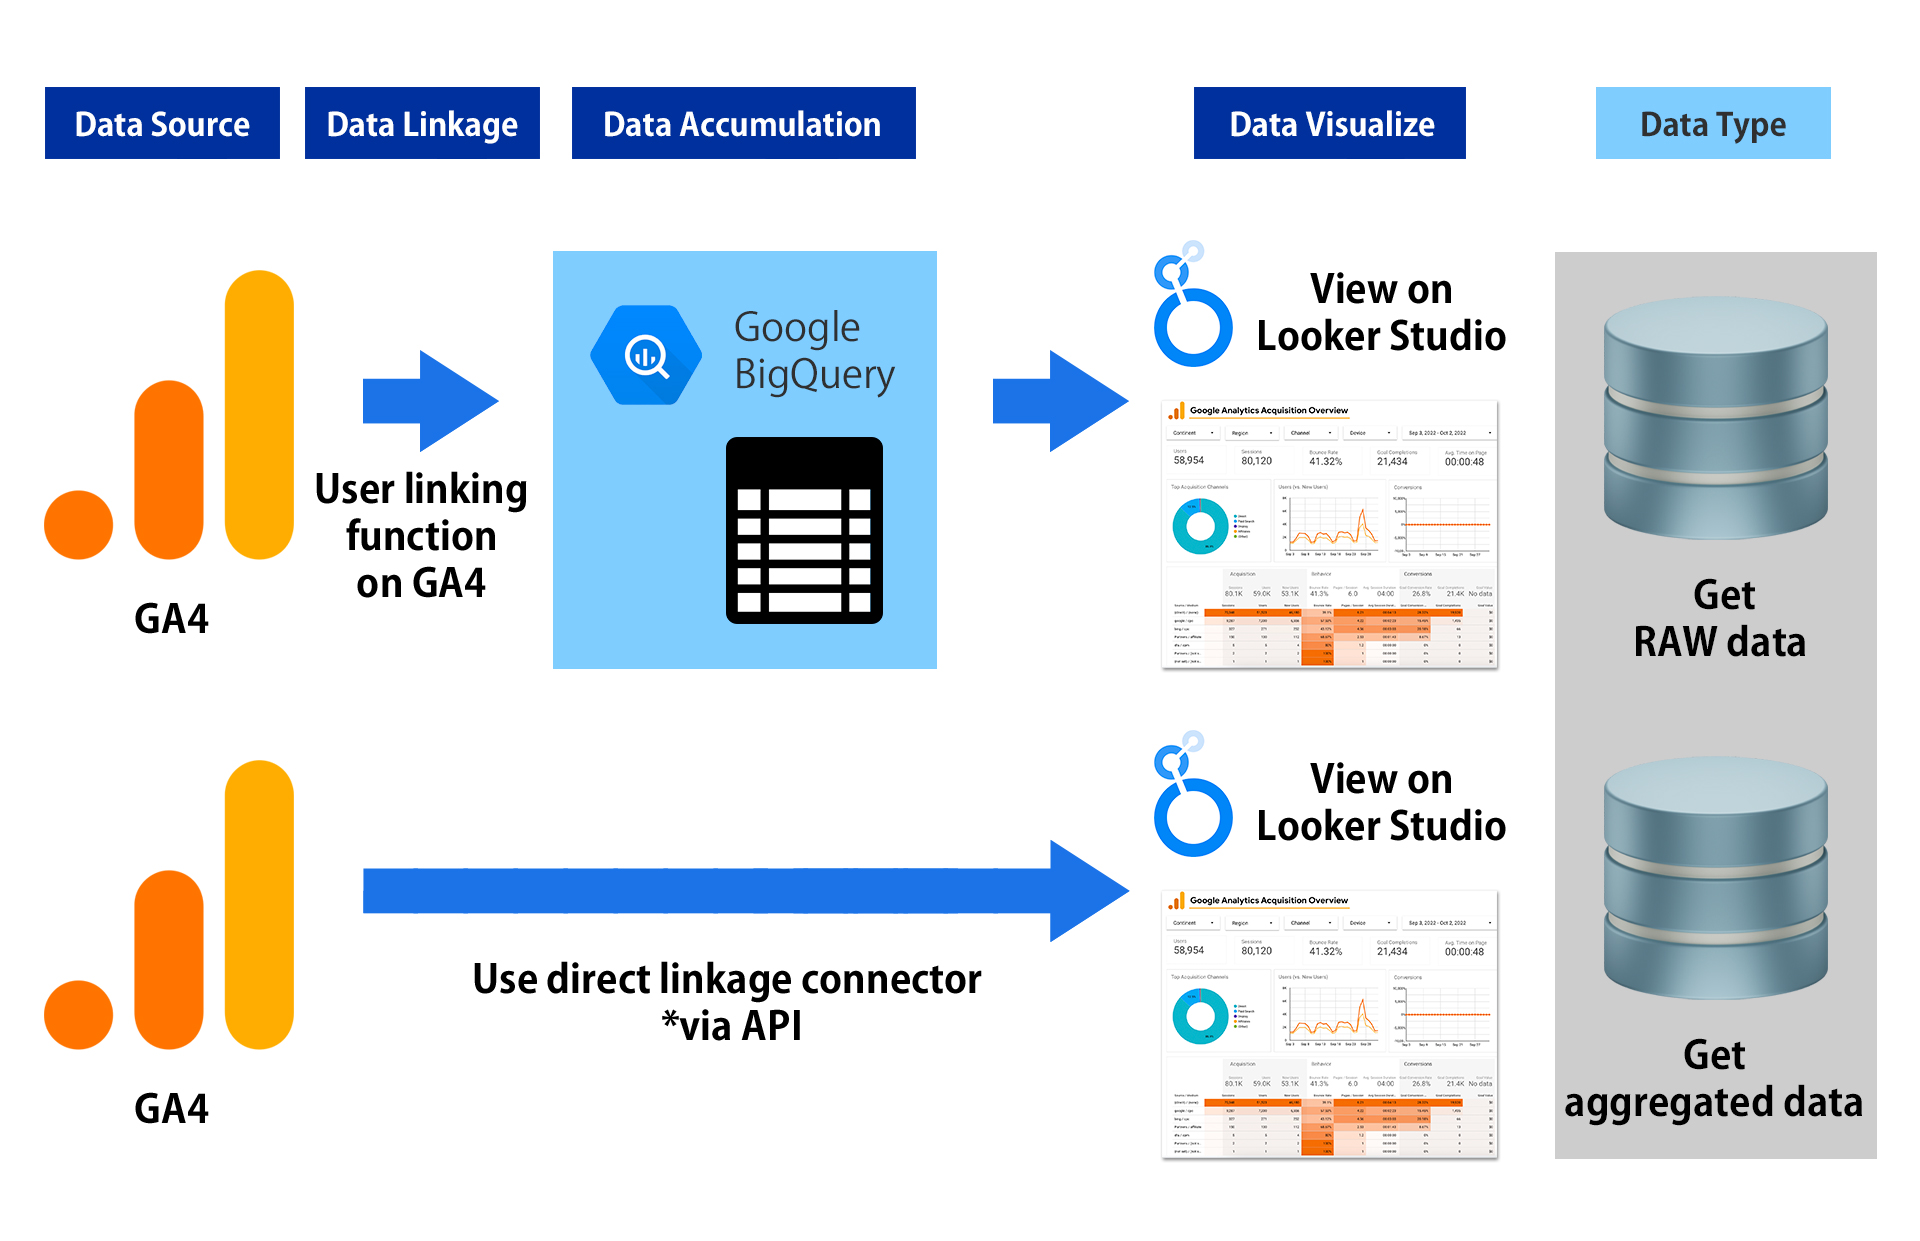
There are two ways to aggregate GA4 data with data visualization tools.
One is to directly “specify GA4 properties” and aggregate the data, and the other is to “link BigQuery”.

1.When aggregating by directly “specifying GA4 properties

<Format of acquisition>
Data is acquired via API when connecting to GA4 from Looker Studio.

<Data to be acquired>
The same data as in the standard report is used for the aggregated data.

*Note
Some dimensions and indicators in the standard report cannot be obtained through the API. In addition, when other rows are displayed in Looker Studio, the values in the other rows are not included in the filter aggregation and correct data cannot be displayed.

Google help:https://developers.google.com/analytics/devguides/reporting/data/v1

Factors such as sampling, data thresholds, and problems with the API itself may make it difficult to determine the cause of whether data is being reflected correctly.

2.When “Linking BigQuery” is used for aggregation

When using “BigQuery integration,” you can handle GA4 raw data for dashboarding, which is more versatile than using aggregated data because raw data can be freely processed.

<Format of acquisition>
Export using the GA4 linkage function.

<Data to be acquired>
RAW data similar to the data used in the search report can be acquired.

*Notes
The data is not exactly the same, as it is only similar to the exploratory report.
Some data will not be output to BigQuery and can only be seen in the exploratory report.
You will need to design and build data tables for BI tools based on your analysis requirements.
*Because referencing with RAW data will increase the amount of data and slow down the operation.

3. Aggregation with GA4xBigQuery

BigQuery is a product offered as part of Google Cloud, Google’s cloud service, and is a data warehouse, BigQuery can process data as large as several TB (1 terabyte = 1,000 GB) or several PB (1 petabyte = 1,024 TB) in seconds or tens of seconds, enabling efficient analysis of a wide variety of data.

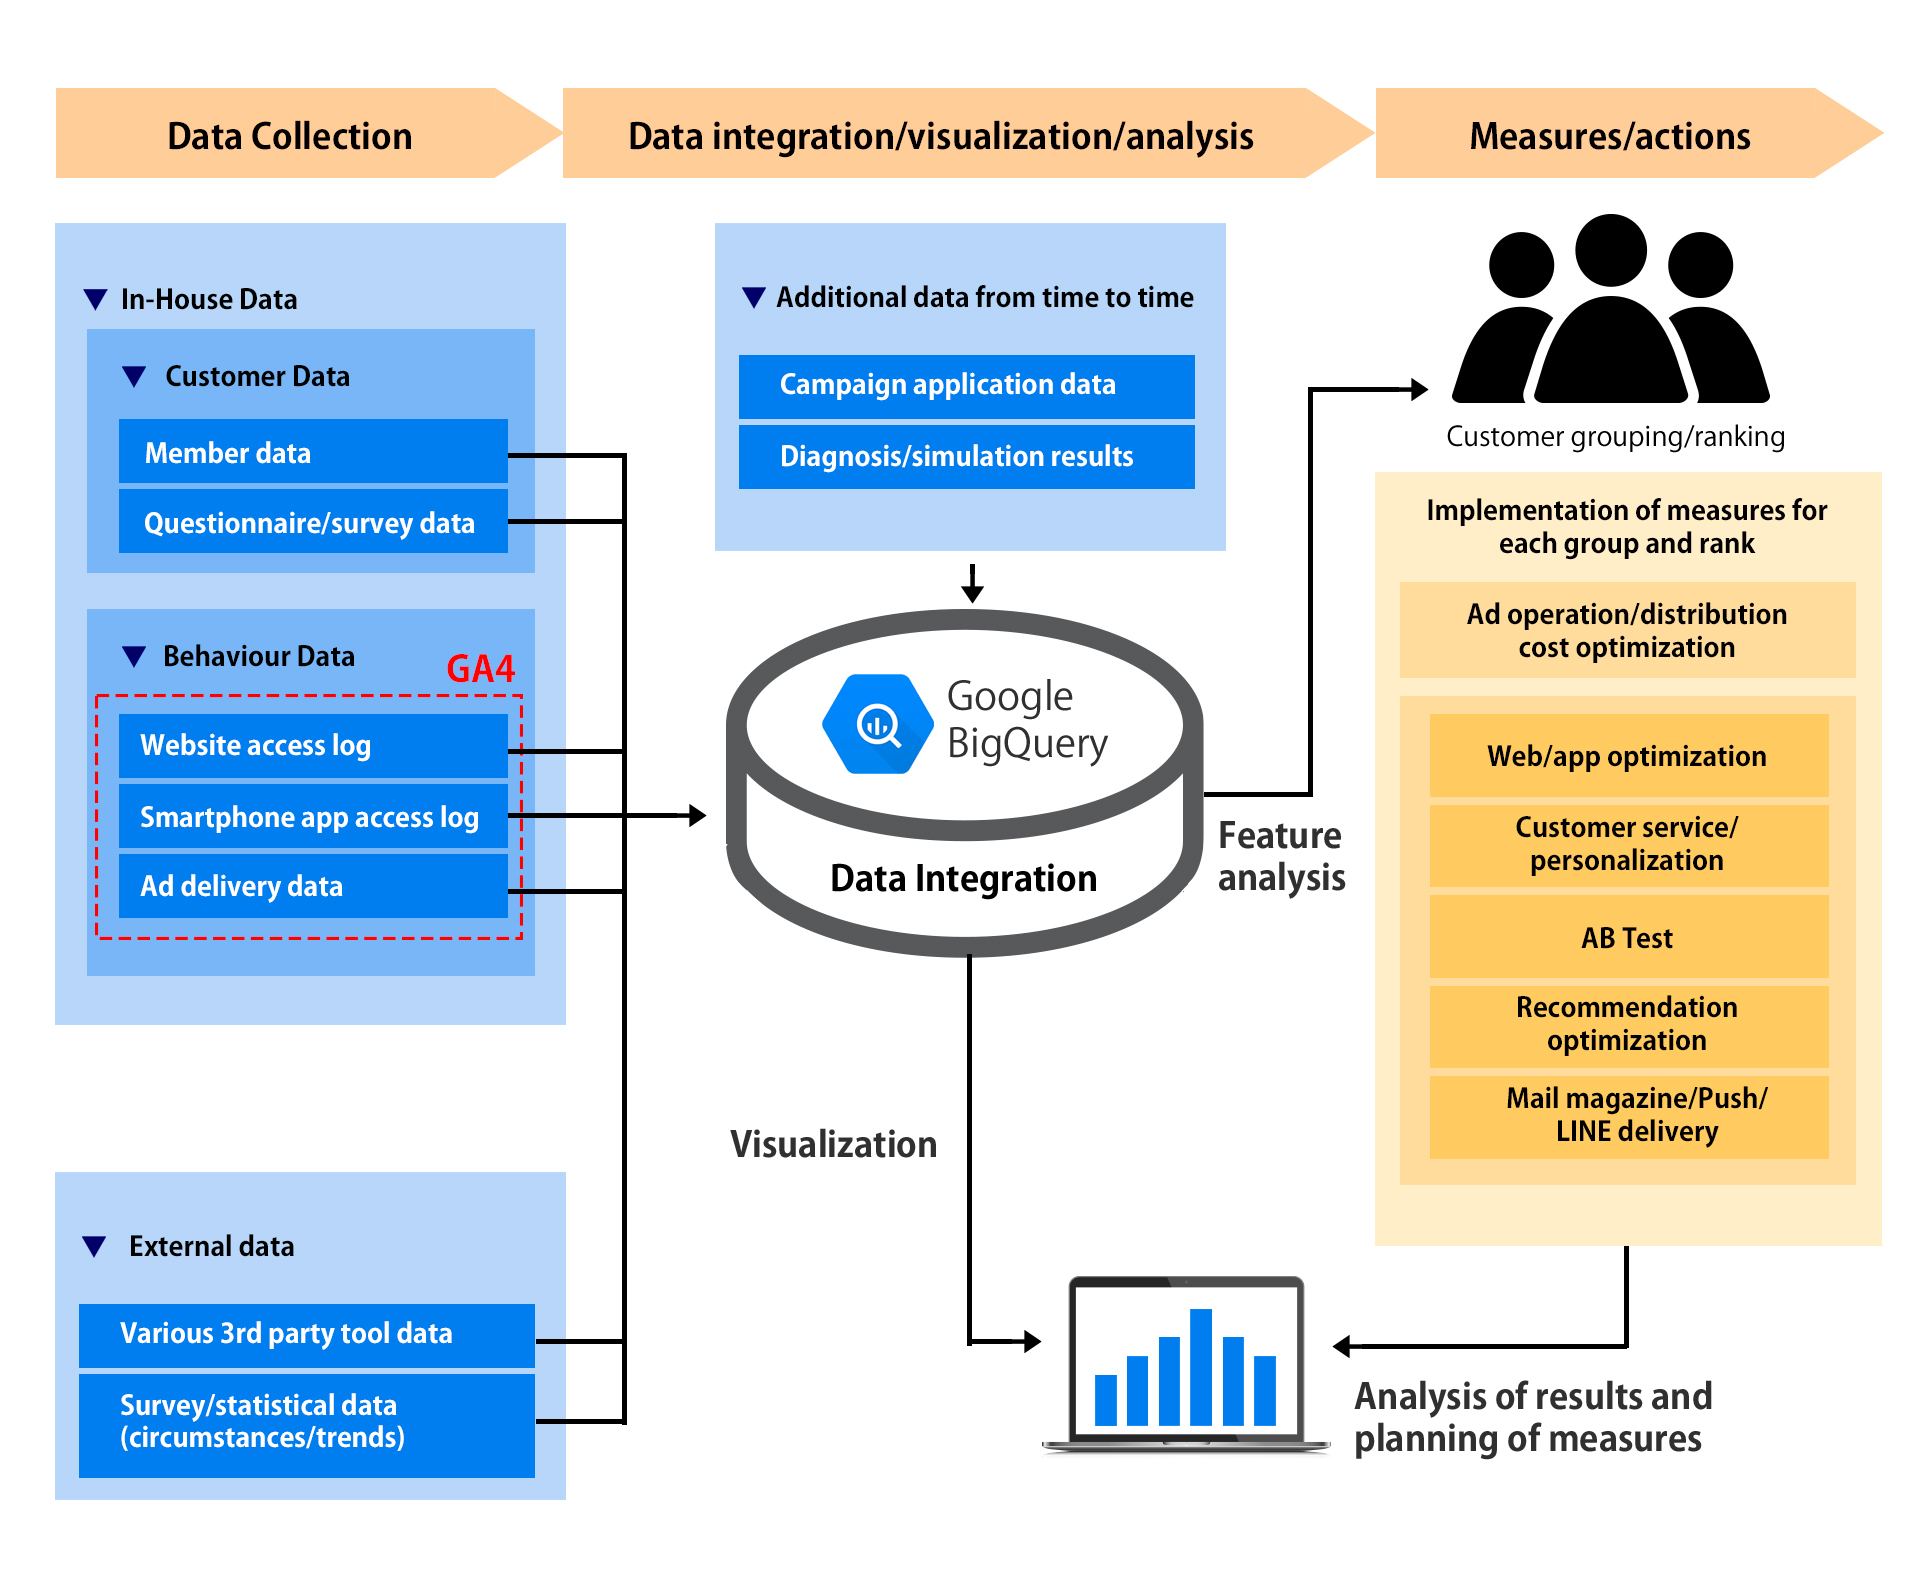
The following advantages can be achieved by linking GA4 and BigQuery.

・Analysis that cannot be achieved with GA4’s exploratory reports is possible.

・The ability to combine offline data, CRM data, and other external data for analysis enables the discovery of customer journeys that were previously unseen.

・GA4 can be used for analysis using machine learning functions on Google Cloud Platform.

・Analysis can be performed in conjunction with external BI tools (Tablueau, Power BI, etc.)

Pros Cons Examples of recommended usage scenarios
GA4 report

Standard report

・No need to create default reports as they are displayed in GA4

・No cost

・It is easily affected by sampling and thresholds.

・Difficult to narrow down data

・Difficult to narrow down data
・Insight detailed analysis is not possible

・When using simple indicators to identify general trends

・To use for hypothesizing for analysis

GA4 report
Exploration report
・Easy to generate reports

・No cost

・Difficult to share reports

・Difficult to share reports

・Difficult to get a complete picture of the data

・For individual deep-dive analysis of data

・Trial before analyzing with Looker Studio or BigQuery

・To test hypotheses made using standard reports

GA4 x Looker studio ・Easy to create without engineers or technical IT staffs ・As with the standard report, if the amount of data is too large, it is aggregated into (other).

・Some dimensions and metrics are not available.

・To allow users who are not authorized to view the GA4 report screen to view mainly simple dimension or metrics

・To check KPI and monitoring indicators

GA4xBigQuery ・Easy to obtain data that is difficult and time-consuming to obtain on GA4’s report screen

・Analysis that is not possible with GA4’s exploration reports is possible.

・The analysis can be combined with offline data, CRM data, and other external data, enabling the discovery of customer journeys that were previously invisible.

・GA4 can be used for analysis using machine learning functions on Google Cloud Platform.

・Analysis can be performed in conjunction with external BI tools (Tablueau, Power BI, etc.)

・Costly to build (requires engineers)

・Costly to refer to reports

・When you want to visualize GA4 data precisely

・When you want to dig deeper into issues on a user-by-user basis

・When you want to analyze data integrated with other external data or offline data

GA4 enables cross-device analysis based on users, and there are high expectations that it will enable access analysis that is more in line with actual conditions than UA. It is necessary to utilize reports according to various purposes and usage scenarios.

We offer GA4 implementation support services. Please feel free to contact us.

Google Analytics will stop collecting new hits. Start moving to Google Analytics 4 now