Introduction
Website analytics is a crucial element for the success of any businesses who have websites. Google Analytics 4 (GA4) is one of the most commonly used tools that is provided by Google for free. This article provides a detailed explanation of how to check page views (PVs) using GA4.
In Google Analytics 4 (GA4), there are three methods to check page views (PV):
① Checking through “Events” : This method allows you to get a rough estimate of the overall page views on your website. By navigating to the “Events” section, you can view the total number of page views as an event.
② Checking through “Pages and Screens” : This method is useful when you want to examine page views on a per-page basis. By accessing the “Pages and Screens” section, you can see the page views for each specific page on your website.
③ Checking through “Exploration” : This method enables you to perform more in-depth analysis and create exploration reports to examine page views. By utilizing the “Exploration” feature, you can generate detailed reports that provide insights into page views.
Method 1 : Checking through “Events”
This method is suitable for gaining an overview of overall page views and understanding their fluctuations.
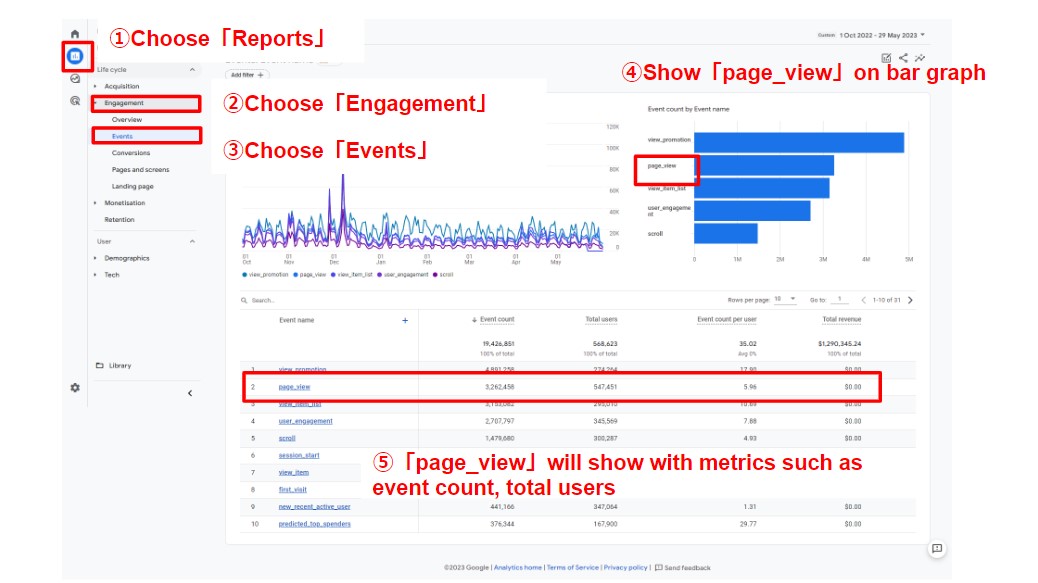
You can follow these steps to access page view data in GA4:
- In the left-side menu of GA4, click on “Reports.”
- Expand the “Engagement” section and select “Events.”
- Inside the “Events” section, you will find a graph for the “page_view” event and data for “page_view” event count.
By clicking on the “page_view” item, you can view various data related to page views in the report.This report provides an overview of page views for the entire site and displays different data related to page views.
Method 2: Checking through “Pages and Screens”
This method allows you to check page views on a per-page basis.
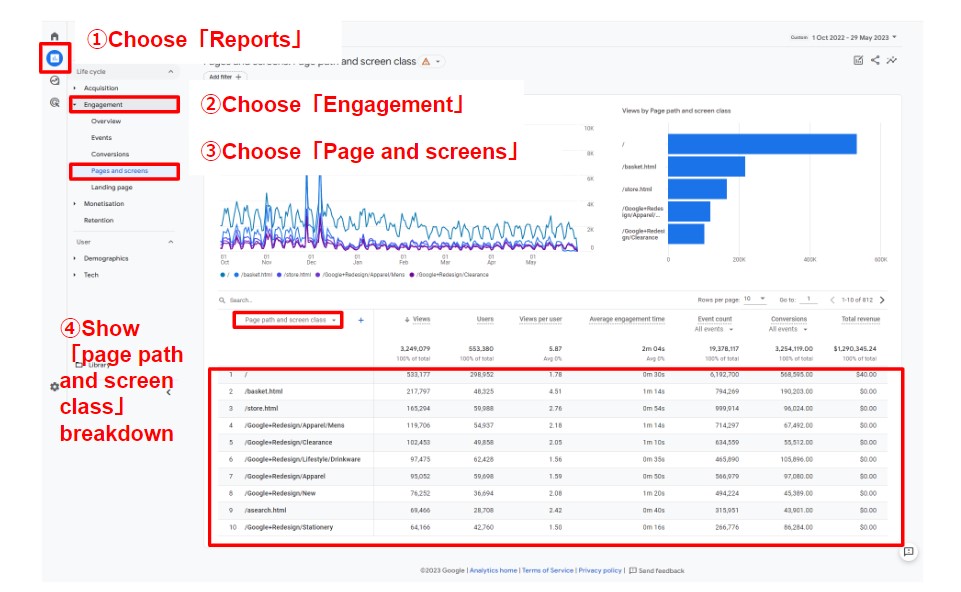
To check page views using this method in GA4, follow these steps:
- In the left-side menu, click on “Reports.”
- Expand the “Engagement” section and select “Pages and Screens.”
- Within the “Pages and Screens” section, you can view the page views for each specific page on your website. The report will display the number of views for each page, allowing you to see the page views on a page-by-page basis.
In the image for step 4, the vertical axis (dimensions) represents the page titles, and the horizontal axis displays various metrics.
The values displayed in the “Page Views” column, which is equivalent to “Impressions” in GA4, represent the number of page views for each individual page.
In Universal Analytics (UA), the “Page” dimension displayed the URL of the pages. However, in GA4, the dimension “Page Title and Screen Class” is used, which displays the page titles.
Note: The “Screen Class” dimension is specific to app tracking in GA4 and will only be displayed if you are tracking an app. If you are not tracking an app, it will not be shown.
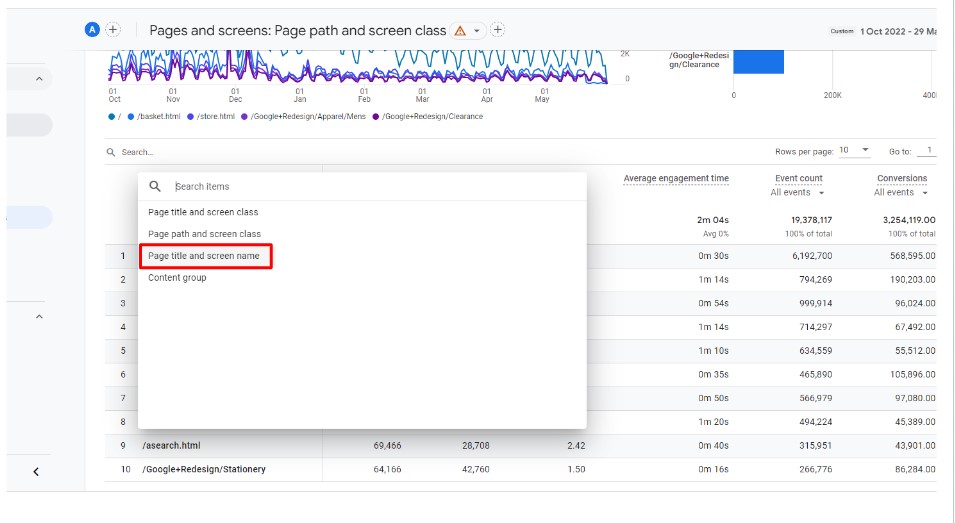
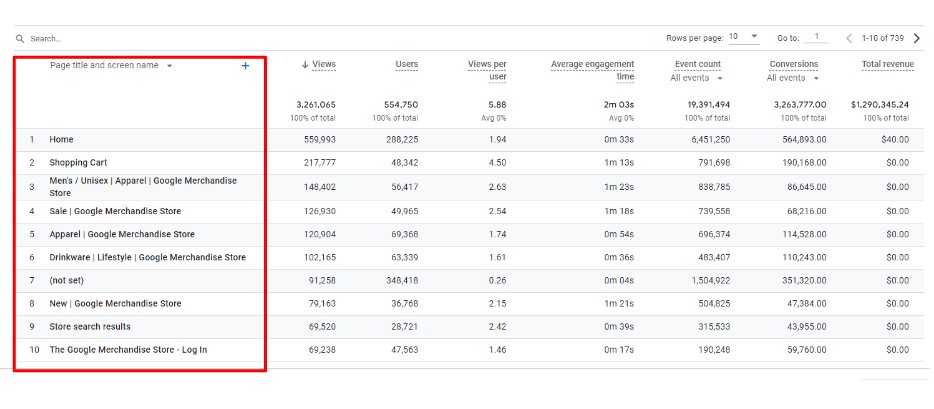
Also if you change the dimension by clicking the arrow next to the dimension name, to “Page title and screen name”, it will show the data of page title that was measured.
Method 3: Checking through “Exploration”
You can create customized reports using the “Exploration” feature to analyze page views and other metrics.
To create a new custom report in GA4, follow these steps:
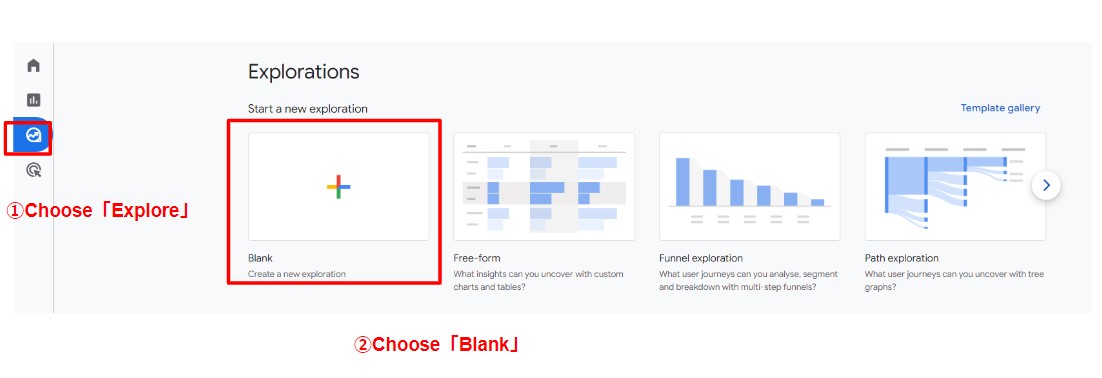
- In the left-side menu of GA4, click on “Exploration.”
- Select a blank space to start a new customization report.
By following these steps, you can create a new custom report where you can explore and analyze page views along with other relevant metrics.
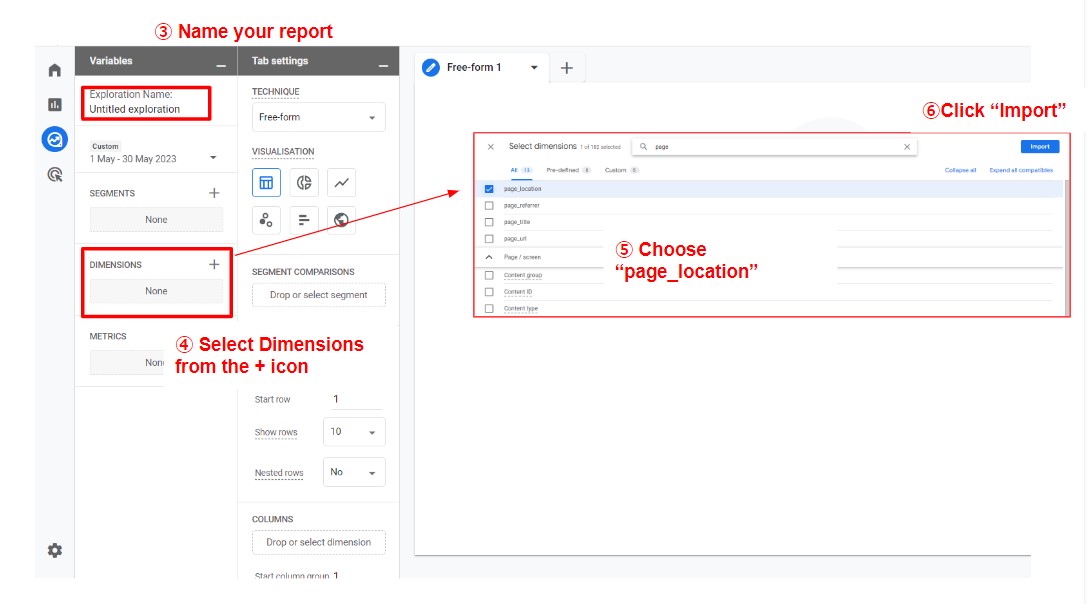
- Name your report
When creating new blank report, the default name for the data exploration will be “Untitled Exploration.” Please provide a desired name for the data exploration. The report name that you have saved will be displayed in the list of exploration screens. - Set up “page_location” on dimensions
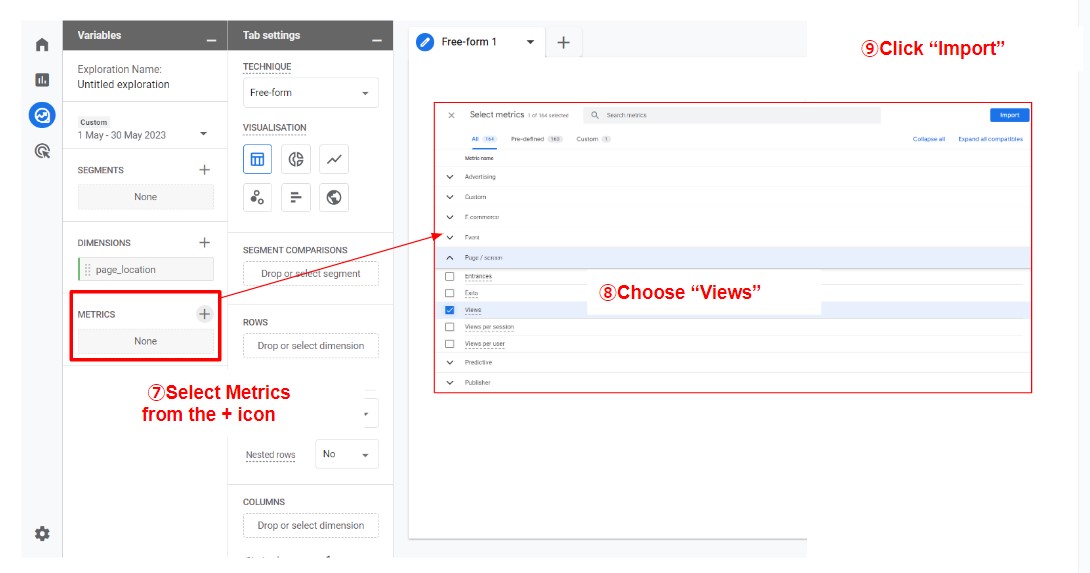
- Set up “Views” on metrics
- Once you set up the dimension and metrics, drag and drop the “page_location” that you selected on dimensions to ROWS and “views” that you selected on metrics to VALUES
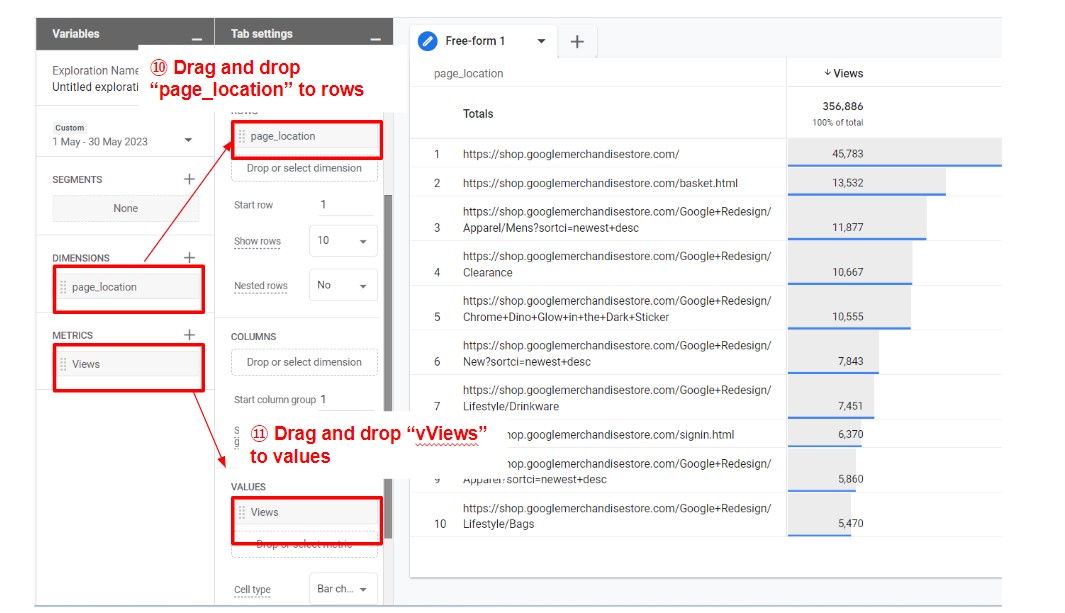
Once you have set up the variables on the rows and values area, the data will show in the right area. You can check the views by each page location (by page URL). We have introduced the 3 ways to check the page views on GA4. By using event-based tracking, leveraging event reports and user engagement sections, you can gain detailed insights into the page views of your website.


